


Search 12,000+ Infographics!

Serviced Accommodation: 8 Common Myths Busted
Experts from the global serviced accommodations specialists Situ, dispel some common myths about serviced accommodation in this infographic. They start with the cost. Contrary to general opinion, serviced accommodation is actually cheaper than a hotel for longer stays.

Mouse Olympics: Record-Breaking Feats
Here is an infographic showcasing the astonishing athletic abilities of mice. From high jumps to long-distance sprints, these tiny rodents display incredible speed, agility, and strength compared to humans.
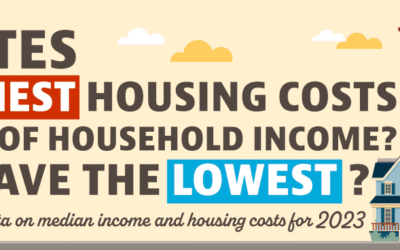
Which States Have the Highest Housing Costs as a Percentage of Household Income?
The team at Madison Trust Company used extensive Census Bureau data to determine where people spend the highest percentage of their income on housing. They found which states have the highest and lowest housing costs and ranked them on a colorful map.

50 Eye-Opening Domestic Violence Statistics for 2024
Domestic violence wreaks havoc in homes and usually has long-term consequences for victims. An infographic created by the team at Joslyn Law Firm demonstrates the huge scope of domestic violence in the United States. They selected 50 statistics that make clear the depth and severity of domestic violence.

Where in the U.S. are the Highest Rates of Child Abuse?
A study from the Joslyn Law Firm highlights how prevalent the issue of child abuse is in the United States. The team gathered data on statistics to determine which states have the highest and lowest rates of child abuse. The following infographic is loaded with information and statistics that bring awareness to this serious issue.

50 Science Fiction Technologies and How Long They Took to Become Reality
We enjoy technology and often take it for granted in our modern world. But in many cases, it was a concept that was once pure imagination manifested in science fiction novels, films, and myths. In this analysis from AIPRM, they’ve compiled a list of 50 real-life technologies to showcase their journey from imaginative concept to tangible reality.
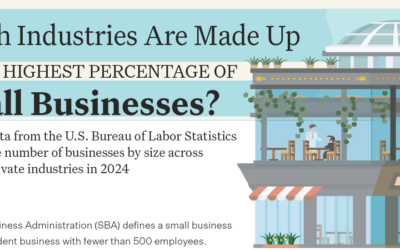
Which Industries Have the Highest Percentage of Small Businesses?
In the following infographic, the Ooma team broke down which industries rely on small businesses to operate. Some of the industries on the list are composed almost entirely of small businesses, highlighting their importance to local and national economies.

The Ultimate Timeline of Artificial Intelligence Technology
From the early ancient ideas and inventions that led to today’s predictive text software, the team at AIPRM charted the progress of AI technology. Starting in the ancient era, we find figures like the Persian Father of Algebra, Al-Khwarizmi. His discovery of algorithms made computing possible, which, in turn, made AI possible.
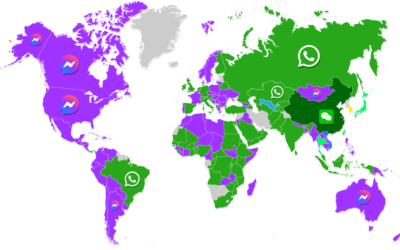
The Most Popular Messaging Apps By Country
The team at Ooma examined the ever-changing world of messenger communication by gathering data on the most popular apps around the world. They used their results to map out the most popular choice in each country and determine which app is used the most by calculating the number of people in each country who used the app.
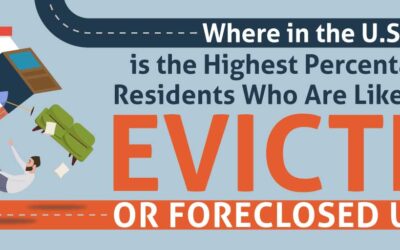
Which U.S. Areas Have The Highest Risk Of Eviction Or Foreclosure?
The team at Mortgage Calculator offers us a look at the cost-of-living crisis through the lens of eviction and foreclosure rates. They used the number of people behind on rent or mortgage payments to determine the number of people who were in danger of eviction or foreclosure and then mapped this to U.S. metro areas.
Serviced Accommodation: 8 Common Myths Busted
Experts from the global serviced accommodations specialists Situ, dispel some common myths about serviced accommodation in this infographic. They start with the cost. Contrary to general opinion, serviced accommodation is actually cheaper than a hotel for longer stays.
Mouse Olympics: Record-Breaking Feats
Here is an infographic showcasing the astonishing athletic abilities of mice. From high jumps to long-distance sprints, these tiny rodents display incredible speed, agility, and strength compared to humans.
Which States Have the Highest Housing Costs as a Percentage of Household Income?
The team at Madison Trust Company used extensive Census Bureau data to determine where people spend the highest percentage of their income on housing. They found which states have the highest and lowest housing costs and ranked them on a colorful map.
50 Eye-Opening Domestic Violence Statistics for 2024
Domestic violence wreaks havoc in homes and usually has long-term consequences for victims. An infographic created by the team at Joslyn Law Firm demonstrates the huge scope of domestic violence in the United States. They selected 50 statistics that make clear the depth and severity of domestic violence.
Where in the U.S. are the Highest Rates of Child Abuse?
A study from the Joslyn Law Firm highlights how prevalent the issue of child abuse is in the United States. The team gathered data on statistics to determine which states have the highest and lowest rates of child abuse. The following infographic is loaded with information and statistics that bring awareness to this serious issue.
50 Science Fiction Technologies and How Long They Took to Become Reality
We enjoy technology and often take it for granted in our modern world. But in many cases, it was a concept that was once pure imagination manifested in science fiction novels, films, and myths. In this analysis from AIPRM, they’ve compiled a list of 50 real-life technologies to showcase their journey from imaginative concept to tangible reality.
Which Industries Have the Highest Percentage of Small Businesses?
In the following infographic, the Ooma team broke down which industries rely on small businesses to operate. Some of the industries on the list are composed almost entirely of small businesses, highlighting their importance to local and national economies.
The Ultimate Timeline of Artificial Intelligence Technology
From the early ancient ideas and inventions that led to today’s predictive text software, the team at AIPRM charted the progress of AI technology. Starting in the ancient era, we find figures like the Persian Father of Algebra, Al-Khwarizmi. His discovery of algorithms made computing possible, which, in turn, made AI possible.
The Most Popular Messaging Apps By Country
The team at Ooma examined the ever-changing world of messenger communication by gathering data on the most popular apps around the world. They used their results to map out the most popular choice in each country and determine which app is used the most by calculating the number of people in each country who used the app.
Which U.S. Areas Have The Highest Risk Of Eviction Or Foreclosure?
The team at Mortgage Calculator offers us a look at the cost-of-living crisis through the lens of eviction and foreclosure rates. They used the number of people behind on rent or mortgage payments to determine the number of people who were in danger of eviction or foreclosure and then mapped this to U.S. metro areas.
Partners


Browse Archives By Category
Animated Infographics
Business Infographics
Career & Jobs Infographics
Education Infographics
Entertainment Industry Infographics
Environmental Infographics
Finance & Money Infographics
Food & Drink Infographics
Health Infographics
Historical Infographics
Home & Garden Infographics
Internet Infographics
Law and Legal Infographics
Lifestyle Infographics
Marketing Infographics
Offbeat Infographics
Parenting Infographics
Pets & Animals Infographics
Political Infographics
Shopping Infographics
Sports and Athletic Infographics
Technology Infographics
Transportation Infographics
Travel Infographics
Video Infographics