


Search 12,100+ Infographics!

A Look at 10 Famous Lawyer Entrepreneurs
There have been many famous lawyers throughout history who, in addition to practicing law, also built and ran successful businesses or participated in ventures that didn’t always relate directly to law. This tradition of lawyers investing time and resources into other unrelated ventures has continued over time. The following infographic highlights a few entrepreneurial lawyers who have found great success in other ventures they chose to develop or invested in after receiving their law degrees.

Securing Our Schools: The Need For Safety in the Classroom
America has a history of 250 years of violence in schools where 297 people have been killed in 137 fatal school shootings. What have we learned from them and the major components for creating a safe school climate are presented in an interesting infographic.

Self-Service Customer Support
One area where businesses may struggle the most is customer support. Whether it be a lack of information, or trouble finding resources, getting help to your customer is a necessity in today’s marketplace, and is essential for customer satisfaction. Desk.com has created an infographic detailing the importance of the online support center, and how customers are increasingly relying on this system to solve their issue
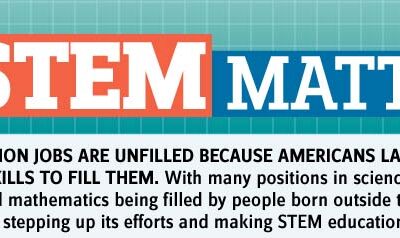
Why STEM Matters
Science, technology, engineering, and math (STEM): these four subjects may strike fear in students across the nation. However, these degrees are becoming more valuable each day. In fact, there are over 3 million jobs available in the STEM marketplace, and many of these positions are being outsourced due to a lack of qualified applicants in the United States.
Top 10 Car Brands on Social Media
Best Car Brands On Social Media is the result of an accurate report from Reputation Radar about the official profiles of the main car brands, realized with the aim to measure their activities on three social media channels, Facebook, Twitter and YouTube.
How Responsive Design Can Increase Your Conversion Rate
With more and mote people using mobile devices such as smart phones and tablets, having a web site that can accommodate these devices is essential for success. In this infographic, learn about what responsive web design can do for your business with this infographic.
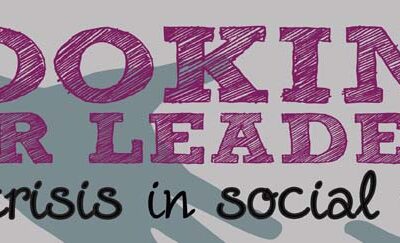
Looking for Leaders: The Crisis in Social Work
Why become a social worker? Check out this infographic and discover many reasons including the fact that there is ample job opportunity for people who feel a calling to help, it’s cool to help others – celebrities contribute to social programs and more.
12 Local Citation Building Best Practices
Building local citations is the hardest part of getting your business visible in the local search results. In the following infographic, learn some best practices for building local citations.
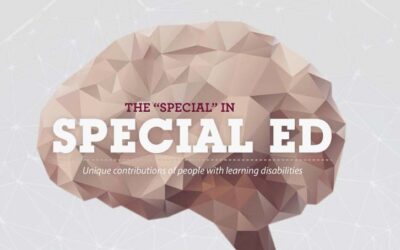
The ‘Special’ in Special Ed
There are some amazing people out there with mental disabilities. Check out the infographic below to learn about the unique contributions of people with learning disabilities.
The Digital Disconnect: Small Business Customers Want More Engagement Online
Most small business owners know that having a business website and a presence on social media are important to their growth and success. However, most small business owners are falling short of consumers’ expectations, according to the latest Web.com Consumer and Small Business Perception Survey. As a result, these entrepreneurs are missing out on opportunities to increase their sales, create loyal customers and build lasting customer relationships.
A Look at 10 Famous Lawyer Entrepreneurs
There have been many famous lawyers throughout history who, in addition to practicing law, also built and ran successful businesses or participated in ventures that didn’t always relate directly to law. This tradition of lawyers investing time and resources into other unrelated ventures has continued over time. The following infographic highlights a few entrepreneurial lawyers who have found great success in other ventures they chose to develop or invested in after receiving their law degrees.
Securing Our Schools: The Need For Safety in the Classroom
America has a history of 250 years of violence in schools where 297 people have been killed in 137 fatal school shootings. What have we learned from them and the major components for creating a safe school climate are presented in an interesting infographic.
Self-Service Customer Support
One area where businesses may struggle the most is customer support. Whether it be a lack of information, or trouble finding resources, getting help to your customer is a necessity in today’s marketplace, and is essential for customer satisfaction. Desk.com has created an infographic detailing the importance of the online support center, and how customers are increasingly relying on this system to solve their issue
Why STEM Matters
Science, technology, engineering, and math (STEM): these four subjects may strike fear in students across the nation. However, these degrees are becoming more valuable each day. In fact, there are over 3 million jobs available in the STEM marketplace, and many of these positions are being outsourced due to a lack of qualified applicants in the United States.
Top 10 Car Brands on Social Media
Best Car Brands On Social Media is the result of an accurate report from Reputation Radar about the official profiles of the main car brands, realized with the aim to measure their activities on three social media channels, Facebook, Twitter and YouTube.
How Responsive Design Can Increase Your Conversion Rate
With more and mote people using mobile devices such as smart phones and tablets, having a web site that can accommodate these devices is essential for success. In this infographic, learn about what responsive web design can do for your business with this infographic.
Looking for Leaders: The Crisis in Social Work
Why become a social worker? Check out this infographic and discover many reasons including the fact that there is ample job opportunity for people who feel a calling to help, it’s cool to help others – celebrities contribute to social programs and more.
12 Local Citation Building Best Practices
Building local citations is the hardest part of getting your business visible in the local search results. In the following infographic, learn some best practices for building local citations.
The ‘Special’ in Special Ed
There are some amazing people out there with mental disabilities. Check out the infographic below to learn about the unique contributions of people with learning disabilities.
The Digital Disconnect: Small Business Customers Want More Engagement Online
Most small business owners know that having a business website and a presence on social media are important to their growth and success. However, most small business owners are falling short of consumers’ expectations, according to the latest Web.com Consumer and Small Business Perception Survey. As a result, these entrepreneurs are missing out on opportunities to increase their sales, create loyal customers and build lasting customer relationships.
Partners


Browse Archives By Category
Animated Infographics
Business Infographics
Career & Jobs Infographics
Education Infographics
Entertainment Industry Infographics
Environmental Infographics
Finance & Money Infographics
Food & Drink Infographics
Health Infographics
Historical Infographics
Home & Garden Infographics
Internet Infographics
Law and Legal Infographics
Lifestyle Infographics
Marketing Infographics
Offbeat Infographics
Parenting Infographics
Pets & Animals Infographics
Political Infographics
Shopping Infographics
Sports and Athletic Infographics
Technology Infographics
Transportation Infographics
Travel Infographics
Video Infographics