


Search 12,100+ Infographics!

Teaching with Tech
Learning disabilities and special needs can be challenging for parents and educators. Thinking outside the box, and coming up with new ways to implement learning is a constant process. Educators are beginning to discover that traditional learning methods, including worksheets and textbooks, leave students lacking.
Keeping Connected: The Importance of Mobile WiFi for Commuters
Technology-addicted consumers have come to expect mobile WiFi everywhere they go – especially during their morning commute. This infographic outlines the growing demand for mobile WiFi by commuters, how they use it, the changing face of mass transit riders, and the growing use of WiFi on buses and trains.
How Lucky Are You To Be Reading This Infographic?
While you only had a tiny weeny chance of ending up here, you’ll be able to find out just how lucky you are to read our infographic. Take a look at this interesting concept in the following infographic entitled, “How Lucky Are You To Be Reading This Infographic?.”
NSA: From Security Provider To Cell Phone Tracker
When you are communicating with other people, chances are that you are being overheard by your very own National Security Agency. Yes, their focus is you rather than the foreign intelligence. Your telecommunication company is faithfully helping them by giving complete...
Post Bariatric Surgery
Post-Bariatric surgery is a serious decision, especially if the individual has already gone through bariatric or weight loss surgery. However, the benefits may out-weigh the risks. Patients who choose post-bariatric surgery after weight loss or bariatric surgery report not only an improved body image but also, improved balance of life, mobility, and self-confidence.

Kids Off to College? Here Are 10 Killer Remodeling Ideas
If you are one of those whose kid is off to college, why not spend a bit more on yourself? Your child is gone, and all of a sudden you find yourself with extra space. What to do? How about remodeling? This handy infographic will give you 10 solid ideas to help you on your way.
Everything You Need To Know About Dog Skin Problems
Dog skin problems are very common. This infographic from will help you understand what might be the problem with you dog, and more specifically what the problem is with their skin.
Wigs Through History
Wigs have been an important part of personal adornment through the centuries where they have been worn to signify wealth and power as well as just fashion items. People have even worn wigs for very practical reasons as far back as Egyptian times for such things as cleanliness and hygiene and to protect the head against the elements. Join us now as we journey through time on the fascinating trail of wigs.
Rally of the Sexes: Which Gender Wins the Match?
Although some male players are against having the same prizes for men and women in tennis, this latest infographic puts them face to face and tells you who the best is.
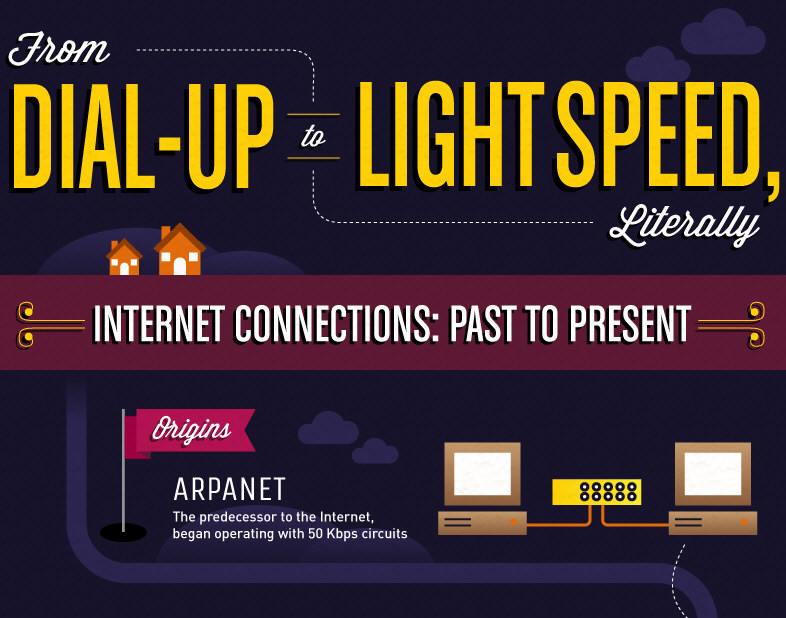
From Dial-Up To Light Speed
From ARPANET to Fiber Optics, we’ve come a very long way in a relatively short amount of time. The following infographic from traces the origins of the Internet from its humble beginnings up through today’s technology. Where do you think it’ll go from here?
Teaching with Tech
Learning disabilities and special needs can be challenging for parents and educators. Thinking outside the box, and coming up with new ways to implement learning is a constant process. Educators are beginning to discover that traditional learning methods, including worksheets and textbooks, leave students lacking.
Keeping Connected: The Importance of Mobile WiFi for Commuters
Technology-addicted consumers have come to expect mobile WiFi everywhere they go – especially during their morning commute. This infographic outlines the growing demand for mobile WiFi by commuters, how they use it, the changing face of mass transit riders, and the growing use of WiFi on buses and trains.
How Lucky Are You To Be Reading This Infographic?
While you only had a tiny weeny chance of ending up here, you’ll be able to find out just how lucky you are to read our infographic. Take a look at this interesting concept in the following infographic entitled, “How Lucky Are You To Be Reading This Infographic?.”
NSA: From Security Provider To Cell Phone Tracker
When you are communicating with other people, chances are that you are being overheard by your very own National Security Agency. Yes, their focus is you rather than the foreign intelligence. Your telecommunication company is faithfully helping them by giving complete...
Post Bariatric Surgery
Post-Bariatric surgery is a serious decision, especially if the individual has already gone through bariatric or weight loss surgery. However, the benefits may out-weigh the risks. Patients who choose post-bariatric surgery after weight loss or bariatric surgery report not only an improved body image but also, improved balance of life, mobility, and self-confidence.
Kids Off to College? Here Are 10 Killer Remodeling Ideas
If you are one of those whose kid is off to college, why not spend a bit more on yourself? Your child is gone, and all of a sudden you find yourself with extra space. What to do? How about remodeling? This handy infographic will give you 10 solid ideas to help you on your way.
Everything You Need To Know About Dog Skin Problems
Dog skin problems are very common. This infographic from will help you understand what might be the problem with you dog, and more specifically what the problem is with their skin.
Wigs Through History
Wigs have been an important part of personal adornment through the centuries where they have been worn to signify wealth and power as well as just fashion items. People have even worn wigs for very practical reasons as far back as Egyptian times for such things as cleanliness and hygiene and to protect the head against the elements. Join us now as we journey through time on the fascinating trail of wigs.
Rally of the Sexes: Which Gender Wins the Match?
Although some male players are against having the same prizes for men and women in tennis, this latest infographic puts them face to face and tells you who the best is.
From Dial-Up To Light Speed
From ARPANET to Fiber Optics, we’ve come a very long way in a relatively short amount of time. The following infographic from traces the origins of the Internet from its humble beginnings up through today’s technology. Where do you think it’ll go from here?
Partners


Browse Archives By Category
Animated Infographics
Business Infographics
Career & Jobs Infographics
Education Infographics
Entertainment Industry Infographics
Environmental Infographics
Finance & Money Infographics
Food & Drink Infographics
Health Infographics
Historical Infographics
Home & Garden Infographics
Internet Infographics
Law and Legal Infographics
Lifestyle Infographics
Marketing Infographics
Offbeat Infographics
Parenting Infographics
Pets & Animals Infographics
Political Infographics
Shopping Infographics
Sports and Athletic Infographics
Technology Infographics
Transportation Infographics
Travel Infographics
Video Infographics