


Search 12,100+ Infographics!

I’ll Love You Forever, Unless There’s a Sale!
Brand loyalty is very important for businesses, however, sales and promotions seem to be overriding consumers feelings about brand loyalty. Check out the infographic below to learn about how brand loyalty is changing.

How Do Employers View Online Degrees?
With more and more people looking to go into higher education, it’s no surprise that many are looking at studying their degree online as a viable option. But how to employers view online degrees? Are they considered in the same way as traditional degrees?
The Complete Guide to Colour Psychology
Color psychology is a fascinating subject and one that has received a phenomenal amount of research and discussion in the last few years. This infographic looks at the associations of color, the differences in cultural meanings, the theory of color psychology and charts a series of interesting examples of color usage from all over the world.
Unveiled the Shocking Facts of iOS
The shocking facts of iOS have been revealed; how an imbalance between privacy and functionality on an iOS can expose iPhone users to greater online and software threats. In this infographic, discover tips for an iOS device from a list of different factors, traits, exercise patterns.
The Solar Timeline
Ever wondered how solar energy came into our lives? This Solar Timeline from The Eco Experts looks at all the milestone events of the the solar journey. You may be surprised to see just how long humans have been utilizing the power of the sun and also inspired by the innovative ways we have been doing it.
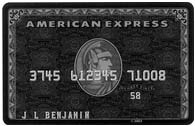
The American Express Centurion “Black Card”
When we think of the mythical American Express black card, we tend to think of images of fabulously wealthy people plunking the card down to pay for items that cost more than most Americans earn in a year – or possibly even in a decade. The American Express “black” is actually the American Express Centurion Black card and that image is not a terribly far cry from reality.
Everything You Need To Know About Menorca
Menorca is one of the beautiful Balearic Islands and a popular holiday destination for tourists arriving from Europe and beyond. With its year round sunshine and beautiful beaches, Menorca ticks all the boxes! However there is much more to Menorca than just the nice weather. Here is a list of all the key facts you could ever wish to know about this beautiful island, check it out here.
US Open 2013 Kings of the Court
It’s the final Grand Slam event of the year! This infographic makes a comparison of this years favorite players and looks at the US Open over the years.
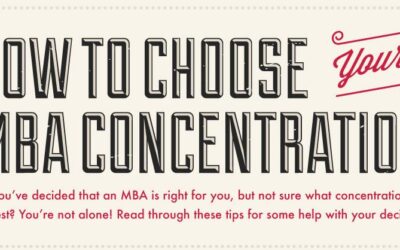
How To Choose Your MBA Concentration
This infographic aims to help prospective MBA students decide which MBA program concentration is right for them. It poses many interesting ideas to get creative juices flowing, so that effective self-reflection may be achieved.
Supersize Road Trip – Coast to Coast Across Australia
Journalist Feann Torr, on behalf of motoring.com.au, bravely decided to travel west across Australia, from Brisbane to Perth, in a brand new shiny red Mazda6. It took Feann five days to complete the epic trek. Find out just how many kangaroos he only narrowly managed to avoid as well as other interesting information.
I’ll Love You Forever, Unless There’s a Sale!
Brand loyalty is very important for businesses, however, sales and promotions seem to be overriding consumers feelings about brand loyalty. Check out the infographic below to learn about how brand loyalty is changing.
How Do Employers View Online Degrees?
With more and more people looking to go into higher education, it’s no surprise that many are looking at studying their degree online as a viable option. But how to employers view online degrees? Are they considered in the same way as traditional degrees?
The Complete Guide to Colour Psychology
Color psychology is a fascinating subject and one that has received a phenomenal amount of research and discussion in the last few years. This infographic looks at the associations of color, the differences in cultural meanings, the theory of color psychology and charts a series of interesting examples of color usage from all over the world.
Unveiled the Shocking Facts of iOS
The shocking facts of iOS have been revealed; how an imbalance between privacy and functionality on an iOS can expose iPhone users to greater online and software threats. In this infographic, discover tips for an iOS device from a list of different factors, traits, exercise patterns.
The Solar Timeline
Ever wondered how solar energy came into our lives? This Solar Timeline from The Eco Experts looks at all the milestone events of the the solar journey. You may be surprised to see just how long humans have been utilizing the power of the sun and also inspired by the innovative ways we have been doing it.
The American Express Centurion “Black Card”
When we think of the mythical American Express black card, we tend to think of images of fabulously wealthy people plunking the card down to pay for items that cost more than most Americans earn in a year – or possibly even in a decade. The American Express “black” is actually the American Express Centurion Black card and that image is not a terribly far cry from reality.
Everything You Need To Know About Menorca
Menorca is one of the beautiful Balearic Islands and a popular holiday destination for tourists arriving from Europe and beyond. With its year round sunshine and beautiful beaches, Menorca ticks all the boxes! However there is much more to Menorca than just the nice weather. Here is a list of all the key facts you could ever wish to know about this beautiful island, check it out here.
US Open 2013 Kings of the Court
It’s the final Grand Slam event of the year! This infographic makes a comparison of this years favorite players and looks at the US Open over the years.
How To Choose Your MBA Concentration
This infographic aims to help prospective MBA students decide which MBA program concentration is right for them. It poses many interesting ideas to get creative juices flowing, so that effective self-reflection may be achieved.
Supersize Road Trip – Coast to Coast Across Australia
Journalist Feann Torr, on behalf of motoring.com.au, bravely decided to travel west across Australia, from Brisbane to Perth, in a brand new shiny red Mazda6. It took Feann five days to complete the epic trek. Find out just how many kangaroos he only narrowly managed to avoid as well as other interesting information.
Partners


Browse Archives By Category
Animated Infographics
Business Infographics
Career & Jobs Infographics
Education Infographics
Entertainment Industry Infographics
Environmental Infographics
Finance & Money Infographics
Food & Drink Infographics
Health Infographics
Historical Infographics
Home & Garden Infographics
Internet Infographics
Law and Legal Infographics
Lifestyle Infographics
Marketing Infographics
Offbeat Infographics
Parenting Infographics
Pets & Animals Infographics
Political Infographics
Shopping Infographics
Sports and Athletic Infographics
Technology Infographics
Transportation Infographics
Travel Infographics
Video Infographics