


Search 12,100+ Infographics!
Chew On This: Impact of Food-Borne Illnesses
Illnesses caused by food-borne contaminants affect millions of Americans every year. Hundreds of thousands are hospitalized, miss work or even die. The result is a multibillion-dollar impact on the U.S. economy and healthcare industry. And the real kicker? Most of these infections could be prevented by simple safety precautions.
Nanomedicine: The Future of Medicine
Nanomedicine refers to highly specific medical intervention at the molecular level for curing disease or repairing damaged tissues. Though in its infancy, could we be looking at the future of medicine? Early clinical trials certainly look promising. Learn more in this infographic.
Which Jobs Lead to Substance Abuse?
Drug abuse can cause irreparable harm on one’s body, a well-known fact supported by thorough research. What often goes overlooked is how drug addiction can impact one’s ability in the workplace, in addition to how it can negatively impact their co-workers. Learn more about which jobs are most likley to lead to substance abuse in this infographic.

Loss of Biodiversity
Loss of biodiversity is a result of multiple environmental issues, such as: habitat destruction, poaching, overfishing, illegal hunting and the business of capturing threatened and endangered species for export. Currently 1 out of 8 bird species are threatened with extinction and 1 out of 4 mammal species are threatened with extinction.
Mega Meals: Kitchen Impossible
Chef Robert Irvine is known for creating outstanding meals under the toughest of circumstances. Now, you can pick up some of his best tips with the following “Kitchen Impossible” infographic.
A Timeline of Facebook Parties Gone Wrong
Did you think that the movie “Project X” was just fiction? Not really! Check some real life parties that deserved to be immortalized in film in this infographic.
Evolution of Lead Generation
Since the beginning of time the art of lead generation has been used by companies large and small to sell, grow and ultimately succeed. From ads in the first newspapers, the first American billboards and the first radio commercials, to the first unsolicited commercial email, the first web banner ad and the new term “Viral Marketing,” the process of lead generation has evolved.
Degrees of the 21st Century
With time, degrees have become less traditional. Because of science and technology, many new areas of expertise are opening up. Check out the infographic below to learn about the best degrees of the 21st century.
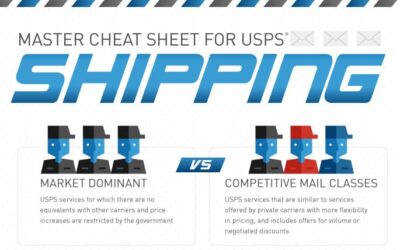
Master Cheat Sheet for USPS Shipping
Whether you’re a beginning eCommerce retailer or a more experienced shipper, knowing the ins and outs of the USPS can help you to secure the best possible shipping rates for your business. Endicia has created this “master cheat sheet for USPS shipping.”
State of Application Security From an IT Manager’s Perspective
Do applications in your organization have vulnerabilities that hackers could exploit? According to a study conducted by Quotium, only 11% of Information Security Managers feel that their applications are secure, despite the fact that the vast majority of them are using a wide range of solutions to mitigate application threats.
Chew On This: Impact of Food-Borne Illnesses
Illnesses caused by food-borne contaminants affect millions of Americans every year. Hundreds of thousands are hospitalized, miss work or even die. The result is a multibillion-dollar impact on the U.S. economy and healthcare industry. And the real kicker? Most of these infections could be prevented by simple safety precautions.
Nanomedicine: The Future of Medicine
Nanomedicine refers to highly specific medical intervention at the molecular level for curing disease or repairing damaged tissues. Though in its infancy, could we be looking at the future of medicine? Early clinical trials certainly look promising. Learn more in this infographic.
Which Jobs Lead to Substance Abuse?
Drug abuse can cause irreparable harm on one’s body, a well-known fact supported by thorough research. What often goes overlooked is how drug addiction can impact one’s ability in the workplace, in addition to how it can negatively impact their co-workers. Learn more about which jobs are most likley to lead to substance abuse in this infographic.
Loss of Biodiversity
Loss of biodiversity is a result of multiple environmental issues, such as: habitat destruction, poaching, overfishing, illegal hunting and the business of capturing threatened and endangered species for export. Currently 1 out of 8 bird species are threatened with extinction and 1 out of 4 mammal species are threatened with extinction.
Mega Meals: Kitchen Impossible
Chef Robert Irvine is known for creating outstanding meals under the toughest of circumstances. Now, you can pick up some of his best tips with the following “Kitchen Impossible” infographic.
A Timeline of Facebook Parties Gone Wrong
Did you think that the movie “Project X” was just fiction? Not really! Check some real life parties that deserved to be immortalized in film in this infographic.
Evolution of Lead Generation
Since the beginning of time the art of lead generation has been used by companies large and small to sell, grow and ultimately succeed. From ads in the first newspapers, the first American billboards and the first radio commercials, to the first unsolicited commercial email, the first web banner ad and the new term “Viral Marketing,” the process of lead generation has evolved.
Degrees of the 21st Century
With time, degrees have become less traditional. Because of science and technology, many new areas of expertise are opening up. Check out the infographic below to learn about the best degrees of the 21st century.
Master Cheat Sheet for USPS Shipping
Whether you’re a beginning eCommerce retailer or a more experienced shipper, knowing the ins and outs of the USPS can help you to secure the best possible shipping rates for your business. Endicia has created this “master cheat sheet for USPS shipping.”
State of Application Security From an IT Manager’s Perspective
Do applications in your organization have vulnerabilities that hackers could exploit? According to a study conducted by Quotium, only 11% of Information Security Managers feel that their applications are secure, despite the fact that the vast majority of them are using a wide range of solutions to mitigate application threats.
Partners


Browse Archives By Category
Animated Infographics
Business Infographics
Career & Jobs Infographics
Education Infographics
Entertainment Industry Infographics
Environmental Infographics
Finance & Money Infographics
Food & Drink Infographics
Health Infographics
Historical Infographics
Home & Garden Infographics
Internet Infographics
Law and Legal Infographics
Lifestyle Infographics
Marketing Infographics
Offbeat Infographics
Parenting Infographics
Pets & Animals Infographics
Political Infographics
Shopping Infographics
Sports and Athletic Infographics
Technology Infographics
Transportation Infographics
Travel Infographics
Video Infographics