


Search 12,100+ Infographics!
Beer Logos From Around The World
Frank Zappa famously quoted “You can’t be a real country unless you have a beer and an airline. It helps if you have some kind of a football team, or some nuclear weapons, but at the very least you need a beer.” Now, I’m not necessarily suggesting for one minute that this is true but this illustration certainly seems to resonate with Franks famous wit.
Super Sedan – Australia’s Most Powerful Production Car
Australian muscle pioneers, Holden, have just released the HSV Gen-F GTS, the most powerful Australian production car ever. But just how well does this Antipodean upstart compare to its American and European competitors? Once you’ve seen just how well the Holden fairs, check out more car reviews with ratings at Motoring.com.au where thousands of cars are compared and reviewed.
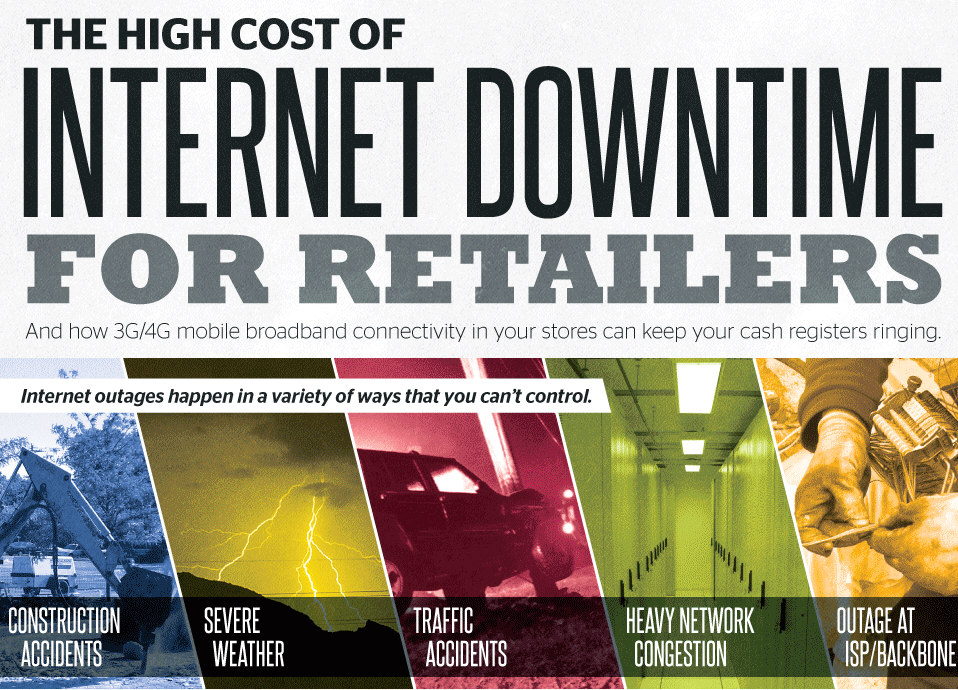
The High Cost of Internet Downtime for Retailers
Almost every business experiences internet outages, and they can be costly. Check out the infographic below to learn about how internet outages can affect your business and how you can work around them.
How to Hurricane Proof Your Home
There are several steps you should take to protect your home if you live in a hurricane zone. From securing your windows to checking your landscape, this infographic by US Door & More has a simple checklist to follow. They also have suggestions for a hurricane survival kit.

Celebrity Relationships: The Good, the Bad & the Ugly
Celebrity relationships are many times unlike the relationships of “normal” folks and often the subject of interest and news. Gateway Homes UK takes a look at the Good, Bad and the Ugly of star pairings including the wealthiest couples, the shortest marriages and the rockiest relationships. We’ll even let you have a guess at who serial-dumper Taylor Swift will date next.
Is Public WiFi Safe?
In the past year public Wi-Fi usage has gone up 240%, but the questions we should be asking: do we need to protect ourselves when we use it and how can be keep ourselves secure? A recent survey by the Identity Theft Resource Center in conjunction with Private WiFi indicates that 79% of respondents believe that free wireless can lead to identity theft. The findings are clear: a personal VPN is your best line of defense.
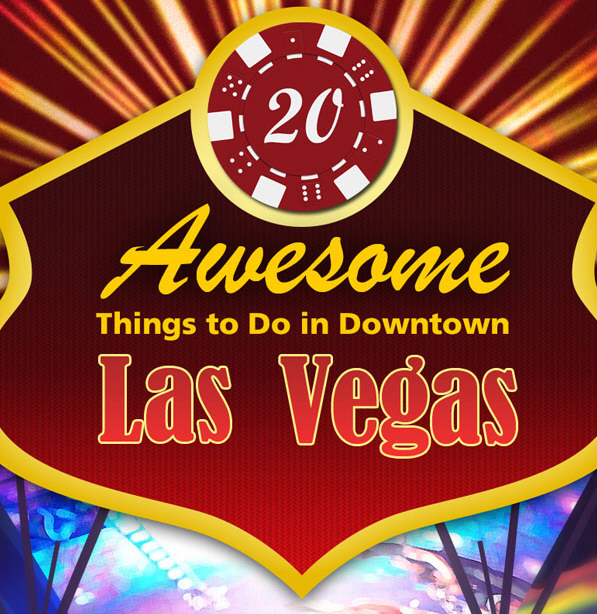
20 Awesome Things to Do in Downtown Las Vegas
Why does everyone go straight to the Vegas strip when there are so many other options in the city? Downtown Las Vegas has a huge selection of restaurants bars, museums and entertainment to choose from and should not be overlooked. Learn about some of downtown’s offerings in this infographic and see what you’re missing out on.

When Customers Stick: Customer Retention by the Numbers
From small businesses to huge corporations, everyone wants to know the secret to keeping customers. How do we earn repeat business for years and years to come? In this infographic, Customers That Stick uses various customer retention statistics to break down the three most important aspects of customer retention: why customers leave, why customers stick, and why retained customers mean money.
A Twitter Guide To Airports
Stuck in an airport with nothing to do? Why not update your Twitter account and let the world know what is going on. Just don’t make any jokes about security or you could find yourself arrested. This and other tips in this “Twitter Guide To Airports.”
Road Safety Awareness
This handy infographic is all about road safety awareness. To begin with there are a few facts about road safety like that two thirds of drivers in the UK admit to breaking the speed limit on motorways. Next up there is information about things that would stop drivers breaking the speed limit. Below that there is a map of the UK showing where most drink driving accidents occur and then finally a few more facts.
Beer Logos From Around The World
Frank Zappa famously quoted “You can’t be a real country unless you have a beer and an airline. It helps if you have some kind of a football team, or some nuclear weapons, but at the very least you need a beer.” Now, I’m not necessarily suggesting for one minute that this is true but this illustration certainly seems to resonate with Franks famous wit.
Super Sedan – Australia’s Most Powerful Production Car
Australian muscle pioneers, Holden, have just released the HSV Gen-F GTS, the most powerful Australian production car ever. But just how well does this Antipodean upstart compare to its American and European competitors? Once you’ve seen just how well the Holden fairs, check out more car reviews with ratings at Motoring.com.au where thousands of cars are compared and reviewed.
The High Cost of Internet Downtime for Retailers
Almost every business experiences internet outages, and they can be costly. Check out the infographic below to learn about how internet outages can affect your business and how you can work around them.
How to Hurricane Proof Your Home
There are several steps you should take to protect your home if you live in a hurricane zone. From securing your windows to checking your landscape, this infographic by US Door & More has a simple checklist to follow. They also have suggestions for a hurricane survival kit.
Celebrity Relationships: The Good, the Bad & the Ugly
Celebrity relationships are many times unlike the relationships of “normal” folks and often the subject of interest and news. Gateway Homes UK takes a look at the Good, Bad and the Ugly of star pairings including the wealthiest couples, the shortest marriages and the rockiest relationships. We’ll even let you have a guess at who serial-dumper Taylor Swift will date next.
Is Public WiFi Safe?
In the past year public Wi-Fi usage has gone up 240%, but the questions we should be asking: do we need to protect ourselves when we use it and how can be keep ourselves secure? A recent survey by the Identity Theft Resource Center in conjunction with Private WiFi indicates that 79% of respondents believe that free wireless can lead to identity theft. The findings are clear: a personal VPN is your best line of defense.
20 Awesome Things to Do in Downtown Las Vegas
Why does everyone go straight to the Vegas strip when there are so many other options in the city? Downtown Las Vegas has a huge selection of restaurants bars, museums and entertainment to choose from and should not be overlooked. Learn about some of downtown’s offerings in this infographic and see what you’re missing out on.
When Customers Stick: Customer Retention by the Numbers
From small businesses to huge corporations, everyone wants to know the secret to keeping customers. How do we earn repeat business for years and years to come? In this infographic, Customers That Stick uses various customer retention statistics to break down the three most important aspects of customer retention: why customers leave, why customers stick, and why retained customers mean money.
A Twitter Guide To Airports
Stuck in an airport with nothing to do? Why not update your Twitter account and let the world know what is going on. Just don’t make any jokes about security or you could find yourself arrested. This and other tips in this “Twitter Guide To Airports.”
Road Safety Awareness
This handy infographic is all about road safety awareness. To begin with there are a few facts about road safety like that two thirds of drivers in the UK admit to breaking the speed limit on motorways. Next up there is information about things that would stop drivers breaking the speed limit. Below that there is a map of the UK showing where most drink driving accidents occur and then finally a few more facts.
Partners


Browse Archives By Category
Animated Infographics
Business Infographics
Career & Jobs Infographics
Education Infographics
Entertainment Industry Infographics
Environmental Infographics
Finance & Money Infographics
Food & Drink Infographics
Health Infographics
Historical Infographics
Home & Garden Infographics
Internet Infographics
Law and Legal Infographics
Lifestyle Infographics
Marketing Infographics
Offbeat Infographics
Parenting Infographics
Pets & Animals Infographics
Political Infographics
Shopping Infographics
Sports and Athletic Infographics
Technology Infographics
Transportation Infographics
Travel Infographics
Video Infographics