


Search 12,100+ Infographics!
What Could Be in Floodwaters?
Floodwaters have some of the worst water quality ratings, carrying a toxic soup of contaminants. Across Mississippi, Alabama, Tennessee, and Georgia, the threat of flooding makes it essential for your safety to understand what could be in your floodwaters. Below, the team at AFS breaks down the most common floodwater contaminants, their health consequences, and what you can do to stay safe during a flood.

FX Black Thursday Explained
Black Swan is a name attached to occasions that can have severe outcomes. Such events are described by their extraordinary irregularity, nearly catastrophic impact, and far-reaching belief that they were obvious in retrospect. Here is an infographic that focuses on an occurrence within the Black Swan category, that is Black Thursday of September 2015.
Reasons Why Infographics Still Matter in SEO
In this infographic, the team at SeoLogist explains why infographics are an adaptable and practical means of communication and marketing and why they should remain a key part of any SEO strategy.

How 3D Building Estimator Has Revolutionized the Metal Building Industry
The landscape of the metal buildings business is changing with the evolution of new technology and advancement. Gone are the days when you need to consult with a dealer and share your customization needs. Today, the entire concept has migrated to the digital platform, and it is further revolutionized with the introduction of 3D metal building estimator technology.
Poser vs. Pro: Which eCommerce Outsourcers Can You Trust With Your Brand?
In response to the dramatic increase in eCommerce demand beginning in 2020, a wave of new Business Process Outsourcing (BPO) has popped up. However, many of these providers lack the experience and expertise required to support a comprehensive eCommerce operation and all the many nuances and requirements involved with that.
20 Ways to Tie Your Shoes
Did you know you can lace your sneakers in different ways? There are many different designs and styles that can add a little fun and personality to your kicks. This infographic shows 20 different ways that shoes can be laced ranging from fun patterns to helpful techniques.

Small Business Accounting Courses
Did you know that 60% of small business owners feel they are not very knowledgeable about accounting and finance? Fortunately, there are plenty of small business accounting courses available to help you get started with accounting. In this infographic, the team at Small Business Learning show the benefits of taking an online accounting course.

Breast Cancer: Symptoms, Diagnosis, Risk Assessment & Facts
Although India’s healthcare has improved significantly over the years thanks to scientific and medical progress, the health status of women in the country is unfortunately still very poor. This infographic has been prepared to highlight the main problems that women face every day, regardless of demographics or region.

How U.S. Food and Product Prices Compare to the Rest of the World
Have you ever wondered how much common American foods and products cost around the world? How do U.S. prices rank among other countries? This infographic visualizes the U.S. prices of popular items and compares them to the countries where these products are the most and least expensive.
The Environmental Impact of Bitcoin
The discussion about the environmental impact of cryptocurrencies – and Bitcoin, specifically – isn’t new, but recent remarks by none other than Elon Musk have given some more notoriety to the issue. That’s why the team at Casinos Blockchain have gathered data from authoritative sources about the environmental impact of Bitcoin and turned it into a helpful infographic.
What Could Be in Floodwaters?
Floodwaters have some of the worst water quality ratings, carrying a toxic soup of contaminants. Across Mississippi, Alabama, Tennessee, and Georgia, the threat of flooding makes it essential for your safety to understand what could be in your floodwaters. Below, the team at AFS breaks down the most common floodwater contaminants, their health consequences, and what you can do to stay safe during a flood.
FX Black Thursday Explained
Black Swan is a name attached to occasions that can have severe outcomes. Such events are described by their extraordinary irregularity, nearly catastrophic impact, and far-reaching belief that they were obvious in retrospect. Here is an infographic that focuses on an occurrence within the Black Swan category, that is Black Thursday of September 2015.
Reasons Why Infographics Still Matter in SEO
In this infographic, the team at SeoLogist explains why infographics are an adaptable and practical means of communication and marketing and why they should remain a key part of any SEO strategy.
How 3D Building Estimator Has Revolutionized the Metal Building Industry
The landscape of the metal buildings business is changing with the evolution of new technology and advancement. Gone are the days when you need to consult with a dealer and share your customization needs. Today, the entire concept has migrated to the digital platform, and it is further revolutionized with the introduction of 3D metal building estimator technology.
Poser vs. Pro: Which eCommerce Outsourcers Can You Trust With Your Brand?
In response to the dramatic increase in eCommerce demand beginning in 2020, a wave of new Business Process Outsourcing (BPO) has popped up. However, many of these providers lack the experience and expertise required to support a comprehensive eCommerce operation and all the many nuances and requirements involved with that.
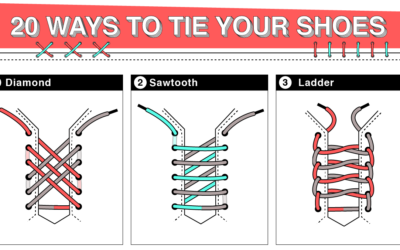
20 Ways to Tie Your Shoes
Did you know you can lace your sneakers in different ways? There are many different designs and styles that can add a little fun and personality to your kicks. This infographic shows 20 different ways that shoes can be laced ranging from fun patterns to helpful techniques.
Small Business Accounting Courses
Did you know that 60% of small business owners feel they are not very knowledgeable about accounting and finance? Fortunately, there are plenty of small business accounting courses available to help you get started with accounting. In this infographic, the team at Small Business Learning show the benefits of taking an online accounting course.
Breast Cancer: Symptoms, Diagnosis, Risk Assessment & Facts
Although India’s healthcare has improved significantly over the years thanks to scientific and medical progress, the health status of women in the country is unfortunately still very poor. This infographic has been prepared to highlight the main problems that women face every day, regardless of demographics or region.
How U.S. Food and Product Prices Compare to the Rest of the World
Have you ever wondered how much common American foods and products cost around the world? How do U.S. prices rank among other countries? This infographic visualizes the U.S. prices of popular items and compares them to the countries where these products are the most and least expensive.
The Environmental Impact of Bitcoin
The discussion about the environmental impact of cryptocurrencies – and Bitcoin, specifically – isn’t new, but recent remarks by none other than Elon Musk have given some more notoriety to the issue. That’s why the team at Casinos Blockchain have gathered data from authoritative sources about the environmental impact of Bitcoin and turned it into a helpful infographic.
Partners


Browse Archives By Category
Animated Infographics
Business Infographics
Career & Jobs Infographics
Education Infographics
Entertainment Industry Infographics
Environmental Infographics
Finance & Money Infographics
Food & Drink Infographics
Health Infographics
Historical Infographics
Home & Garden Infographics
Internet Infographics
Law and Legal Infographics
Lifestyle Infographics
Marketing Infographics
Offbeat Infographics
Parenting Infographics
Pets & Animals Infographics
Political Infographics
Shopping Infographics
Sports and Athletic Infographics
Technology Infographics
Transportation Infographics
Travel Infographics
Video Infographics