


Search 12,100+ Infographics!
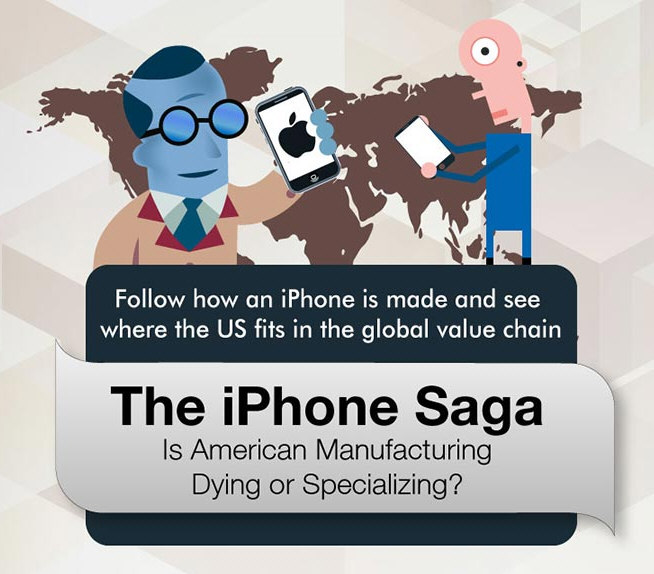
How Much of Apple’s Top Product Is Manufactured in the U.S.
In the wake of rumors that Apple is set to abandon its one-size-fits-all design policy and release budget iPhones with larger screens, where does this leave its current standard bearer? Apple has started “reshoring” production of some of its products (but not iPhones, yet) back to the US, but will this move eventually change the big picture that follows?
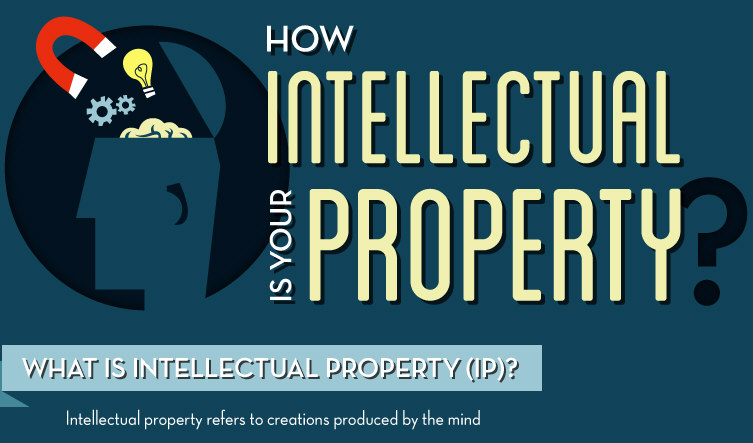
How Intellectual Is Your Property
Did you know that intellectual property (IP) accounts for 20% of the US gross domestic product (GDP) and for 40% of the country’s economic gains? Or that IP-intensive industries employ close to 55 million workers? If you find yourself in one of these fields, it’s important to know the background of intellectual property and IP law in order to understand how to protect your own work.
Military Families on the Move
This infographic is designed to show the number of US Military members and families and the moving process they go through when Uncle Sam sends those Permanent Change of Station (PCS) orders. This will also be of interest to non-military people looking for home purchase vs. renting options including some surprising stats.
BBQ Pit Stops: A Regional Guide to Grilling, Smoking and Sauce
You’re probably familiar with the big BBQ states but did you know about the unique cooking methods or styles of BBQ sauce across the country? Check out this infographic for a breakdown of the main types of BBQ, and what makes these regional BBQ styles unique.
Can America Understand the Obamacare Delays?
Many Americans are not sure about Obamacare and how it works, let alone about the delays taking place. Check out the infographic below to learn about Obamacare and the delays.
Location-Based Marketing
Now, more than ever, consumers are relying on smart phones, mobile search and location-based apps to guide their in-store purchases. This infographic looks at the current state of location-based marketing.
The Psychology of Attraction
What attracts us to certain things? Beauty is in the eye of the beholder, however, there are certain characteristics that catch our eye. Check out the infographic below to learn about the psychology of attraction.

Employers: Get The Scoop On Internships
In light of the many recent intern compensation lawsuits, it’s safe to say internships are in the spotlight. But as an employer, it’s your duty to provide your interns with a lot more than just fair compensation. In fact, if you’re not on trend with the current state of the internship, you’re bound to miss out on a slew of worthy candidates.
What to Look For in a Private Detective Agency
Given the sometimes shady nature of the business, sometimes potential clients are afraid to hire private detectives to solve their problems. This infographic shows what customers should know before deciding which private investigation agency to hire.

Benefits of Trash Removal
TheJunkGuys presents the following infographic that aims at bringing out the big picture of trash in North America and why it becomes imperative to dispose it off properly. This picture is painted by using statistics on garbage and trash production in North America and brings to light some interesting facts about garbage.
How Much of Apple’s Top Product Is Manufactured in the U.S.
In the wake of rumors that Apple is set to abandon its one-size-fits-all design policy and release budget iPhones with larger screens, where does this leave its current standard bearer? Apple has started “reshoring” production of some of its products (but not iPhones, yet) back to the US, but will this move eventually change the big picture that follows?
How Intellectual Is Your Property
Did you know that intellectual property (IP) accounts for 20% of the US gross domestic product (GDP) and for 40% of the country’s economic gains? Or that IP-intensive industries employ close to 55 million workers? If you find yourself in one of these fields, it’s important to know the background of intellectual property and IP law in order to understand how to protect your own work.
Military Families on the Move
This infographic is designed to show the number of US Military members and families and the moving process they go through when Uncle Sam sends those Permanent Change of Station (PCS) orders. This will also be of interest to non-military people looking for home purchase vs. renting options including some surprising stats.
BBQ Pit Stops: A Regional Guide to Grilling, Smoking and Sauce
You’re probably familiar with the big BBQ states but did you know about the unique cooking methods or styles of BBQ sauce across the country? Check out this infographic for a breakdown of the main types of BBQ, and what makes these regional BBQ styles unique.
Can America Understand the Obamacare Delays?
Many Americans are not sure about Obamacare and how it works, let alone about the delays taking place. Check out the infographic below to learn about Obamacare and the delays.
Location-Based Marketing
Now, more than ever, consumers are relying on smart phones, mobile search and location-based apps to guide their in-store purchases. This infographic looks at the current state of location-based marketing.
The Psychology of Attraction
What attracts us to certain things? Beauty is in the eye of the beholder, however, there are certain characteristics that catch our eye. Check out the infographic below to learn about the psychology of attraction.
Employers: Get The Scoop On Internships
In light of the many recent intern compensation lawsuits, it’s safe to say internships are in the spotlight. But as an employer, it’s your duty to provide your interns with a lot more than just fair compensation. In fact, if you’re not on trend with the current state of the internship, you’re bound to miss out on a slew of worthy candidates.
What to Look For in a Private Detective Agency
Given the sometimes shady nature of the business, sometimes potential clients are afraid to hire private detectives to solve their problems. This infographic shows what customers should know before deciding which private investigation agency to hire.
Benefits of Trash Removal
TheJunkGuys presents the following infographic that aims at bringing out the big picture of trash in North America and why it becomes imperative to dispose it off properly. This picture is painted by using statistics on garbage and trash production in North America and brings to light some interesting facts about garbage.
Partners


Browse Archives By Category
Animated Infographics
Business Infographics
Career & Jobs Infographics
Education Infographics
Entertainment Industry Infographics
Environmental Infographics
Finance & Money Infographics
Food & Drink Infographics
Health Infographics
Historical Infographics
Home & Garden Infographics
Internet Infographics
Law and Legal Infographics
Lifestyle Infographics
Marketing Infographics
Offbeat Infographics
Parenting Infographics
Pets & Animals Infographics
Political Infographics
Shopping Infographics
Sports and Athletic Infographics
Technology Infographics
Transportation Infographics
Travel Infographics
Video Infographics