


Search 12,100+ Infographics!

How to Make Coffee and Share Fun Coffee Tips Like a Pro
Improve your coffee knowledge and fatten your pockets with lots of frugal ways to enjoy a cup of coffee in the comforts of your home. Learn how to brew and prepare your favorite coffee blends and pick up perfect coffee pairings in this infographic.
Great Green Places To Stay
HolidayExtras.com teamed up with The Travel Foundation to help promote Make Holidays Greener Month. Check out these great green places to stay around the world, surely that’s enough encouragement for you to take up a greener holiday! Whether you want to relax in a beautiful spa or help the locals in some amazing communities in Kenya, this infographic has it all.
Stinging Insects Pest Control: Know the Difference
Summer brings all kinds of things such as vacations, BBQs, picnics, fun outdoor activities, and more…including stinging insects. Not all stinging insects are created equal though. While you should be concerned about the species that pack a powerful and painful sting and can cause allergic reactions, there is one that should be protected.
Demystifying the Tech Startup Bubble
With IPO flops and billion dollar tech acquisitions, many experts are debating the existence of a tech startup bubble. Is it real? Check out the infographic below presented by BizBrain.org to learn more about the tech startup bubble.
The Cost of Catastrophe
Natural disasters seem to be occurring at an alarming rate. Hurricanes, tornadoes, fires and droughts are just a few of the disasters that impact our world. These events cause catastrophic damage and untold loss every year. In the past decade, disasters have cost more than $3.4 trillion. Emergency-management-degree.org has analyzed the financial impact of these disasters, along with how many businesses and families are prepared for an emergency.
The Life and Death (and Life) of the US Auto Industry
Since the late 1800’s, the automobile has been an American staple in households. From its debut with Henry Ford’s Model A, to next year’s Corvette-cars have always captured America’s attention. But it’s not always been smooth seas for American automobile manufacturers. Bizbrain.org has created a very informal infographic about the history of the automobile, entitled, “The Life, Death, (and Life) of the U.S. Auto Industry”.

15 Fantastic Reasons to Clear Out the Clutter at Home
No one really likes clutter, and summer time is the best time to get rid of stuff you don’t need or use anymore. Check out the infographic below presented by SpareFoot to learn 15 reasons why you should clear out clutter in your home.
Prestashop VS Magento VS Opencart
Which is the best ecommerce system? This infographic provides a detailed comparison of the three most popular ecommerce system.
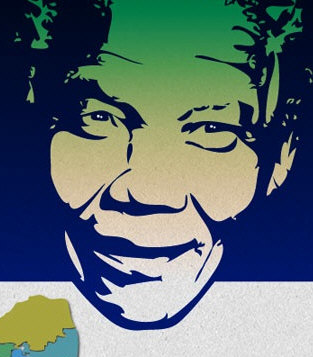
Nelson Mandela: Before Prisoner, Beyond President
Nelson Mandela, the well known South African anti-apartheid revolutionary and politician, is an inspirational figure for the fight against racism an oppression. With his anniversary this week, let us remember what an inspiration the figure has been to all those oppressed and deprived through this timeline depicting his life so far, which has been created by BestMSWPrograms.com.
Five Reasons Beef Fits Fast Casual
With prices of beef hitting a record high, many restaurants are choosing to market different proteins on their menus. However, this probably isn’t the best idea, well, because people love beef! Check out the infographic below presented by FastCasual to learn about how beef can actually increase profits.
How to Make Coffee and Share Fun Coffee Tips Like a Pro
Improve your coffee knowledge and fatten your pockets with lots of frugal ways to enjoy a cup of coffee in the comforts of your home. Learn how to brew and prepare your favorite coffee blends and pick up perfect coffee pairings in this infographic.
Great Green Places To Stay
HolidayExtras.com teamed up with The Travel Foundation to help promote Make Holidays Greener Month. Check out these great green places to stay around the world, surely that’s enough encouragement for you to take up a greener holiday! Whether you want to relax in a beautiful spa or help the locals in some amazing communities in Kenya, this infographic has it all.
Stinging Insects Pest Control: Know the Difference
Summer brings all kinds of things such as vacations, BBQs, picnics, fun outdoor activities, and more…including stinging insects. Not all stinging insects are created equal though. While you should be concerned about the species that pack a powerful and painful sting and can cause allergic reactions, there is one that should be protected.
Demystifying the Tech Startup Bubble
With IPO flops and billion dollar tech acquisitions, many experts are debating the existence of a tech startup bubble. Is it real? Check out the infographic below presented by BizBrain.org to learn more about the tech startup bubble.
The Cost of Catastrophe
Natural disasters seem to be occurring at an alarming rate. Hurricanes, tornadoes, fires and droughts are just a few of the disasters that impact our world. These events cause catastrophic damage and untold loss every year. In the past decade, disasters have cost more than $3.4 trillion. Emergency-management-degree.org has analyzed the financial impact of these disasters, along with how many businesses and families are prepared for an emergency.
The Life and Death (and Life) of the US Auto Industry
Since the late 1800’s, the automobile has been an American staple in households. From its debut with Henry Ford’s Model A, to next year’s Corvette-cars have always captured America’s attention. But it’s not always been smooth seas for American automobile manufacturers. Bizbrain.org has created a very informal infographic about the history of the automobile, entitled, “The Life, Death, (and Life) of the U.S. Auto Industry”.
15 Fantastic Reasons to Clear Out the Clutter at Home
No one really likes clutter, and summer time is the best time to get rid of stuff you don’t need or use anymore. Check out the infographic below presented by SpareFoot to learn 15 reasons why you should clear out clutter in your home.
Prestashop VS Magento VS Opencart
Which is the best ecommerce system? This infographic provides a detailed comparison of the three most popular ecommerce system.
Nelson Mandela: Before Prisoner, Beyond President
Nelson Mandela, the well known South African anti-apartheid revolutionary and politician, is an inspirational figure for the fight against racism an oppression. With his anniversary this week, let us remember what an inspiration the figure has been to all those oppressed and deprived through this timeline depicting his life so far, which has been created by BestMSWPrograms.com.
Five Reasons Beef Fits Fast Casual
With prices of beef hitting a record high, many restaurants are choosing to market different proteins on their menus. However, this probably isn’t the best idea, well, because people love beef! Check out the infographic below presented by FastCasual to learn about how beef can actually increase profits.
Partners


Browse Archives By Category
Animated Infographics
Business Infographics
Career & Jobs Infographics
Education Infographics
Entertainment Industry Infographics
Environmental Infographics
Finance & Money Infographics
Food & Drink Infographics
Health Infographics
Historical Infographics
Home & Garden Infographics
Internet Infographics
Law and Legal Infographics
Lifestyle Infographics
Marketing Infographics
Offbeat Infographics
Parenting Infographics
Pets & Animals Infographics
Political Infographics
Shopping Infographics
Sports and Athletic Infographics
Technology Infographics
Transportation Infographics
Travel Infographics
Video Infographics