


Search 12,100+ Infographics!

15 Fantastic Reasons to Clear Out the Clutter at Home
No one really likes clutter, and summer time is the best time to get rid of stuff you don’t need or use anymore. Check out the infographic below presented by SpareFoot to learn 15 reasons why you should clear out clutter in your home.
Prestashop VS Magento VS Opencart
Which is the best ecommerce system? This infographic provides a detailed comparison of the three most popular ecommerce system.

Nelson Mandela: Before Prisoner, Beyond President
Nelson Mandela, the well known South African anti-apartheid revolutionary and politician, is an inspirational figure for the fight against racism an oppression. With his anniversary this week, let us remember what an inspiration the figure has been to all those oppressed and deprived through this timeline depicting his life so far, which has been created by BestMSWPrograms.com.
Five Reasons Beef Fits Fast Casual
With prices of beef hitting a record high, many restaurants are choosing to market different proteins on their menus. However, this probably isn’t the best idea, well, because people love beef! Check out the infographic below presented by FastCasual to learn about how beef can actually increase profits.
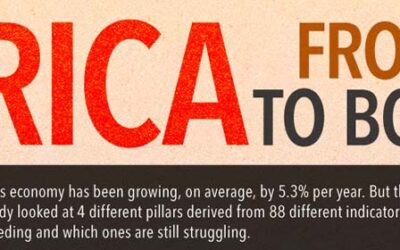
The Top Economies in Africa
For the past decade, Africa’s economy has been growing, on average, by 5.3% per year. But that’s not the full measure of a continent. A recent study looked at 4 different pillars derived from 88 different indicators to help determine which African countries are succeeding and which ones are still struggling.
Failure By Design
Everyone makes mistakes. But when seemingly minor blunders are made in designing and building structures, the results can be catastrophic. Look at “failure by design” in this infographic by New School of Architecture & Design.
Will You Be Able to Afford Long-Term Care?
You will probably need long-term care at some point in your life, but will you be able to afford it? Check out the infographic below presented by AssurePlan to learn about the numbers behind long-term care.
Stress & Your Health
“Stress is not necessarily something bad – it all depends on how you take it. The stress of exhilarating, creative successful work is beneficial, while that of failure, humiliation or infection is detrimental.” —Hans Sely e, pioneer in stress research. Learn more about stress and your health in this infographic.
Facts and Hidden Dangers About DEET
Thinking about using DEET spray or lotion this summer to ward off the mosquitoes? Think twice! Learn about facts and potential dangers of the chemical, DEET, and other safe, natural alternatives in this infographic.
What Is A Cupola?
A great many people have no clue what a cupola actually is. Cupolas are modest dome-like ornamental structures that are place on top of a roof structure. First used in barns, cupolas now are seen everywhere on all sorts of structures. Even though they are not used for venting nowadays as much as for architectural improvement, cupolas are used everywhere around the world including far away places outside the United States.
15 Fantastic Reasons to Clear Out the Clutter at Home
No one really likes clutter, and summer time is the best time to get rid of stuff you don’t need or use anymore. Check out the infographic below presented by SpareFoot to learn 15 reasons why you should clear out clutter in your home.
Prestashop VS Magento VS Opencart
Which is the best ecommerce system? This infographic provides a detailed comparison of the three most popular ecommerce system.
Nelson Mandela: Before Prisoner, Beyond President
Nelson Mandela, the well known South African anti-apartheid revolutionary and politician, is an inspirational figure for the fight against racism an oppression. With his anniversary this week, let us remember what an inspiration the figure has been to all those oppressed and deprived through this timeline depicting his life so far, which has been created by BestMSWPrograms.com.
Five Reasons Beef Fits Fast Casual
With prices of beef hitting a record high, many restaurants are choosing to market different proteins on their menus. However, this probably isn’t the best idea, well, because people love beef! Check out the infographic below presented by FastCasual to learn about how beef can actually increase profits.
The Top Economies in Africa
For the past decade, Africa’s economy has been growing, on average, by 5.3% per year. But that’s not the full measure of a continent. A recent study looked at 4 different pillars derived from 88 different indicators to help determine which African countries are succeeding and which ones are still struggling.
Failure By Design
Everyone makes mistakes. But when seemingly minor blunders are made in designing and building structures, the results can be catastrophic. Look at “failure by design” in this infographic by New School of Architecture & Design.
Will You Be Able to Afford Long-Term Care?
You will probably need long-term care at some point in your life, but will you be able to afford it? Check out the infographic below presented by AssurePlan to learn about the numbers behind long-term care.
Stress & Your Health
“Stress is not necessarily something bad – it all depends on how you take it. The stress of exhilarating, creative successful work is beneficial, while that of failure, humiliation or infection is detrimental.” —Hans Sely e, pioneer in stress research. Learn more about stress and your health in this infographic.
Facts and Hidden Dangers About DEET
Thinking about using DEET spray or lotion this summer to ward off the mosquitoes? Think twice! Learn about facts and potential dangers of the chemical, DEET, and other safe, natural alternatives in this infographic.
What Is A Cupola?
A great many people have no clue what a cupola actually is. Cupolas are modest dome-like ornamental structures that are place on top of a roof structure. First used in barns, cupolas now are seen everywhere on all sorts of structures. Even though they are not used for venting nowadays as much as for architectural improvement, cupolas are used everywhere around the world including far away places outside the United States.
Partners


Browse Archives By Category
Animated Infographics
Business Infographics
Career & Jobs Infographics
Education Infographics
Entertainment Industry Infographics
Environmental Infographics
Finance & Money Infographics
Food & Drink Infographics
Health Infographics
Historical Infographics
Home & Garden Infographics
Internet Infographics
Law and Legal Infographics
Lifestyle Infographics
Marketing Infographics
Offbeat Infographics
Parenting Infographics
Pets & Animals Infographics
Political Infographics
Shopping Infographics
Sports and Athletic Infographics
Technology Infographics
Transportation Infographics
Travel Infographics
Video Infographics