


Search 12,100+ Infographics!
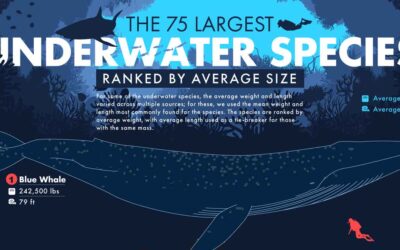
The 75 Largest Underwater Species Ranked by Average Size
With so many fish in the sea, which is the largest? The largest animal in the ocean isn’t a fish at all but rather a whale. What other giant sea creatures lurk under the surface of the water? Take a deep dive into this illustrated chart that compares the average weight and length of the 75 largest underwater species alive today.
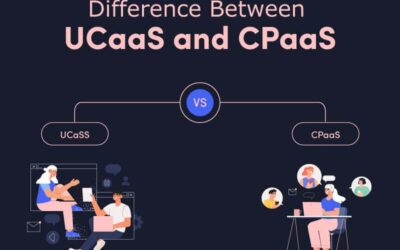
Differences Between UCaaS and CPaaS
Unified Communication as a Service (UCaaS) and Communication Platform as a Service (CPaaS) are cloud-based communication systems that provide a variety of benefits and services to businesses of all sizes. In this infographic, Acefone takes a closer look at UCaaS and CPaaS and how they compare and contrast.
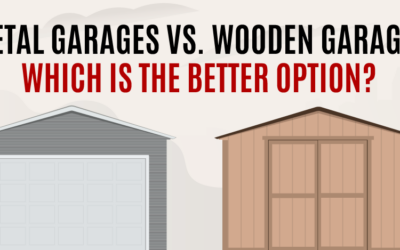
Metal Garages vs. Wooden Garages – Which is the Better Option?
In the last few decades, the demand for steel garage buildings has increased due to its broad traits like affordability and low maintenance. Compared to metal, wood needs frequent maintenance and repairs. There are in fact multiple other factors that make the competition tough. Here is a detailed infographic that provides in-depth knowledge about the two garage types.

How to Shop for Car Insurance Quotes Online
Are your car insurance premiums too high? Tired of spending too much of your hard-earned money on your car insurance bill every month? If so check out this infographic to learn how to better shop car insurance quotes online. The infographic will teach you when you should be getting new car insurance quotes and how to find the best price for your auto insurance premiums.

Childcare in Australia: Facts and Figures
An estimated 1,376,470 million Australian children and 986,000 families attend childcare in Australia. Needless to say that the demand for childcare in recent years are high and there is no sign that the demand will dwindle anytime soon. In the following infographic, it is clear that formal childcare is now quickly taking over the importance that informal childcare used to have.

Coronasomnia: COVID-19 and How It Affects Our Nightly Z’s
With the COVID-19 pandemic driving the world into uncharted waters, profound changes have emerged in almost every area of our lives. With the unprecedented shift coming in so quickly, it’s understandable that the importance of sleep is flying under the radar. However, giving priority to sleep offers benefits that are far more useful than you think.

The Anatomy of a Local Landing Page
It can be challenging to wrap your head around trying to rank at scale for a multi-location SEO strategy. Check out the following infographic and guide, courtesy of Wiideman on how to get there, along with a template in designing local landing pages.
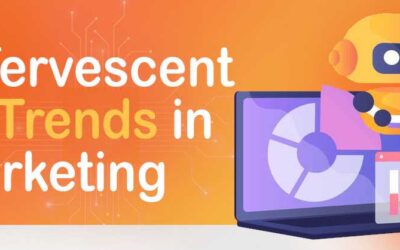
Effervescent AI Trends in Marketing
Artificial Intelligence is one of the best trends in current marketing scenarios. AI helps in pushing the limits of marketing on the innovative path. By analyzing the customers’ behavior, preferences, etc. AI helps develop and segregate the emails as per the countries time zone.

Crypto: Switching From Savings to Payments
There are many benefits in paying for goods and services with crypto assets. These include anonymity and security. Not to mention in recent years several crypto getaways have appeared to make the transactions easy to proceed with. Here is an infographic that depicts the companies and merchants open to crypto payments.
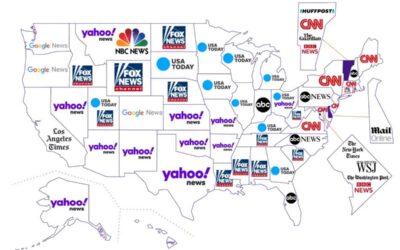
The Most Searched News Sites by State
Using Google Trends, here is an infographic from Semrush that shows all 50 states’ popularity scores for each of the 15 most popular news websites. The popularity scores are scaled from 0 to 100, with 100 points assigned to the location where the site’s name made up the highest proportion of total searches.
The 75 Largest Underwater Species Ranked by Average Size
With so many fish in the sea, which is the largest? The largest animal in the ocean isn’t a fish at all but rather a whale. What other giant sea creatures lurk under the surface of the water? Take a deep dive into this illustrated chart that compares the average weight and length of the 75 largest underwater species alive today.
Differences Between UCaaS and CPaaS
Unified Communication as a Service (UCaaS) and Communication Platform as a Service (CPaaS) are cloud-based communication systems that provide a variety of benefits and services to businesses of all sizes. In this infographic, Acefone takes a closer look at UCaaS and CPaaS and how they compare and contrast.
Metal Garages vs. Wooden Garages – Which is the Better Option?
In the last few decades, the demand for steel garage buildings has increased due to its broad traits like affordability and low maintenance. Compared to metal, wood needs frequent maintenance and repairs. There are in fact multiple other factors that make the competition tough. Here is a detailed infographic that provides in-depth knowledge about the two garage types.
How to Shop for Car Insurance Quotes Online
Are your car insurance premiums too high? Tired of spending too much of your hard-earned money on your car insurance bill every month? If so check out this infographic to learn how to better shop car insurance quotes online. The infographic will teach you when you should be getting new car insurance quotes and how to find the best price for your auto insurance premiums.
Childcare in Australia: Facts and Figures
An estimated 1,376,470 million Australian children and 986,000 families attend childcare in Australia. Needless to say that the demand for childcare in recent years are high and there is no sign that the demand will dwindle anytime soon. In the following infographic, it is clear that formal childcare is now quickly taking over the importance that informal childcare used to have.
Coronasomnia: COVID-19 and How It Affects Our Nightly Z’s
With the COVID-19 pandemic driving the world into uncharted waters, profound changes have emerged in almost every area of our lives. With the unprecedented shift coming in so quickly, it’s understandable that the importance of sleep is flying under the radar. However, giving priority to sleep offers benefits that are far more useful than you think.
The Anatomy of a Local Landing Page
It can be challenging to wrap your head around trying to rank at scale for a multi-location SEO strategy. Check out the following infographic and guide, courtesy of Wiideman on how to get there, along with a template in designing local landing pages.
Effervescent AI Trends in Marketing
Artificial Intelligence is one of the best trends in current marketing scenarios. AI helps in pushing the limits of marketing on the innovative path. By analyzing the customers’ behavior, preferences, etc. AI helps develop and segregate the emails as per the countries time zone.
Crypto: Switching From Savings to Payments
There are many benefits in paying for goods and services with crypto assets. These include anonymity and security. Not to mention in recent years several crypto getaways have appeared to make the transactions easy to proceed with. Here is an infographic that depicts the companies and merchants open to crypto payments.
The Most Searched News Sites by State
Using Google Trends, here is an infographic from Semrush that shows all 50 states’ popularity scores for each of the 15 most popular news websites. The popularity scores are scaled from 0 to 100, with 100 points assigned to the location where the site’s name made up the highest proportion of total searches.
Partners


Browse Archives By Category
Animated Infographics
Business Infographics
Career & Jobs Infographics
Education Infographics
Entertainment Industry Infographics
Environmental Infographics
Finance & Money Infographics
Food & Drink Infographics
Health Infographics
Historical Infographics
Home & Garden Infographics
Internet Infographics
Law and Legal Infographics
Lifestyle Infographics
Marketing Infographics
Offbeat Infographics
Parenting Infographics
Pets & Animals Infographics
Political Infographics
Shopping Infographics
Sports and Athletic Infographics
Technology Infographics
Transportation Infographics
Travel Infographics
Video Infographics