Search 12,000+ Infographics!
The Future of Baby Making
Do you think genetic engineering in humans is right or wrong? Either way, you have to admit that it is pretty interesting. Check out the infographic below presented by CheapNurseDegrees.com to learn about the science behind genetically engineered children.
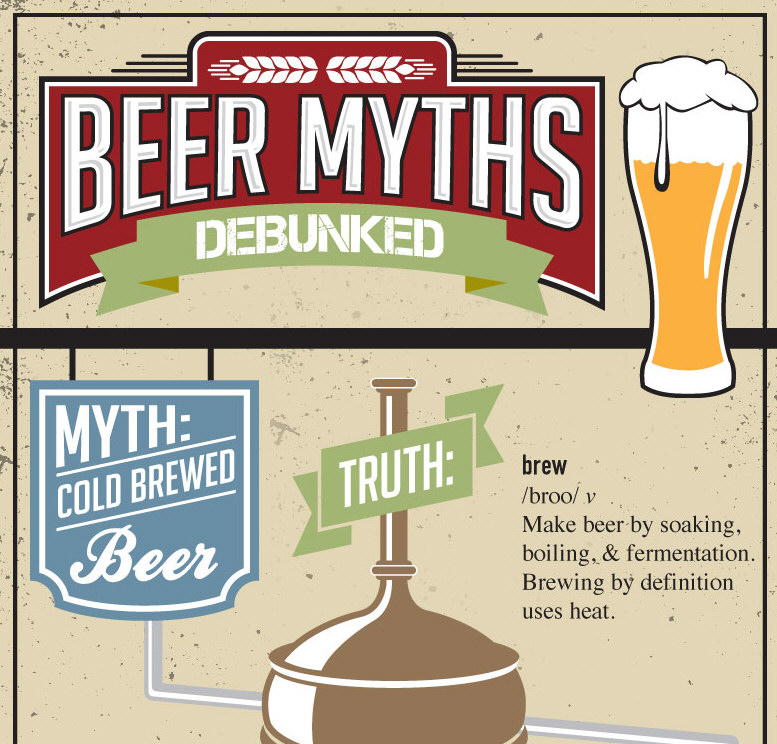
Beer Myths Debunked
There is no doubt that over the years, you have learned some incorrect or misleading information about the beer that you drink. It’s nearly impossible to avoid with so many sources throwing their product at you to get you to buy from them. Well it’s time you learn what the truth is behind all of the myths. Check out this infographic from Karl Strauss to see what is really going on with your beer and how to enjoy in the best way possible.
The Pinterest Effect
A recent Pew study has shown that 15% of Internet users are now on Pinterest, making it the third most-popular social media site in the U.S.. And now the site is making a localized effort in the U.K. Some say that Pinterest is disrupting the social media landscape but is it influencing online purchase behavior as well?
Will You Lose Your Job to Technology?
The 20th century saw a massive loss of jobs in factories as machines replaced humans. The US economy moved to “services” and everyone was happy. Of course service jobs are not going to be replaced by machines are they? Think again!
Road to Riches: Tracking the Journey of the Global Superwealthy
While nearly 1 in 2 people on this planet have a net worth of less than $10,000, a select few are worth more than a million dollars. And an even more select group is worth a billion or more. The following infographic by Best Value Schools tracks the journey of the super wealthy.
The Evolution of the American Family
This infographic by California Cryobank shows how the traditional nuclear family has gradually transformed. From same-sex couples and Choice Moms, to conception via assisted reproduction, and adoption, the composition of the American family has become richer and more complex, but one constant remains — love.
Then vs Now: How Technology in Schools Has Changed Over Time
There have been many advancements in technology since the one-room schoolhouse days. The infographic below takes a look at how technology in schools has evolved over time.
The World’s Dirtiest Jobs
Whether it’s cleaning a smelly animal cage or a bloody crime scene, there are many dirty jobs in the world and somebody has to perform them. This infographic illustrates some of the world’s dirtiest jobs.
History of the Lottery
Scholars disagree as to who started the lottery, but one thing’s for sure…it’s been around for a long time. This infographic takes a look at its history as well as providing some interesting statistics.
Is Your Industry Growing or Dying?
Construction and healthcare-related fields are expected to see exponential growth in the next decade, while jobs at the Post Office and newspapers, well, may go the way of the dodo. Masters In Human Resources Degree Guide takes a look at industries that are growing as well as those that may be dying.
Partners
Browse Archives By Category
Animated Infographics
Business Infographics
Career & Jobs Infographics
Education Infographics
Entertainment Industry Infographics
Environmental Infographics
Finance & Money Infographics
Food & Drink Infographics
Health Infographics
Historical Infographics
Home & Garden Infographics
Internet Infographics
Law and Legal Infographics
Lifestyle Infographics
Marketing Infographics
Offbeat Infographics
Parenting Infographics
Pets & Animals Infographics
Political Infographics
Shopping Infographics
Sports and Athletic Infographics
Technology Infographics
Transportation Infographics
Travel Infographics
Video Infographics


