


Search 12,100+ Infographics!

The Great Gold Rout
What caused the sudden drop in gold price? After a decade of revival, the price fall in April was the biggest dip in market confidence for 30 years. Is this precious metal vulnerable to further decline or is it a temporary setback for the ‘safe-haven asset’? Take a look at the Great Gold Rout infographic from Saxo Capital Markets.
HTML5 Vs Native App Battle
HTML5 vs Native App battle has been going on from long now. While most mobile app developers with enough time and money resources still prefer to go with Native Apps, others are using HTML5 or Hybrid apps to reduce development time.This infographic lists important points through visually rich graphics.
The Growing Mobile (Digital) Publishing Landscape
This infographic from Readz provides an overview of some key numbers in the mobile (digital) publishing landscape. You will find stats on the growing ownership of devices, where reading scores appear in comparison to other favorite activities on devices, when people like to read and on which particular device as well as other such relevant information.
The Truth About the UK’s Legs
Daylong asked 2,000 people all about their legs and answers came in all shapes and sizes. They learned the who, what, where and why of tired, aching legs. They also learned what the UK thinks of compression hosiery. It’s all below in the following infographic simply entitled, “The Truth About the UK’s Legs.”
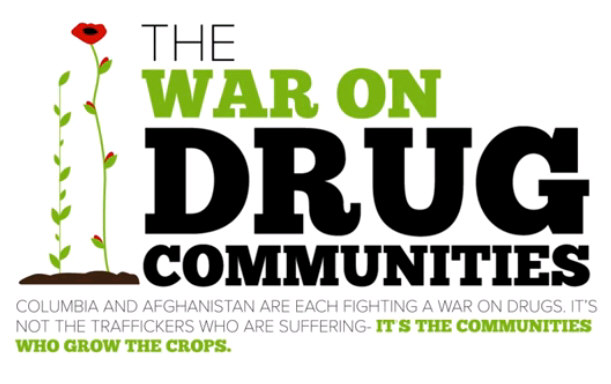
The War on Drug Communities
We have been fighting a War on Drugs since 1971, but what do we have to show for it? Millions of addicts, and to support them, there are millions of people who farm, produce, and distribute the drugs they use. We often don’t think of these poor families because they are not here in the United States – they are in other parts of the war.
Is Online Giving Right For Your Church?
By implementing online giving, churches can see an increase in offerings. Why is this? Because no one really carries around cash and checks anymore, so this gives people a quick and easy way to donate. It can also turn irregular givers into regular givers with options such as recurring payments. Check out the infographic below to learn more about the benefits of online giving for churches.
Have You Seen Your Online Reputation?
The digital revolution has made it increasingly difficult for a brand to maintain control of its online reputation. From talk on social media to articles on other websites and mentions via search engines, it seems like everyone has an opinion about brands and an abundance of online channels to share these views. While positive posts can have a great effect on brand image and sales, negative talk can cause serious harm that could damage a brand for the long-term.

Conquer Clutter in a Month
We all know how difficult it is to de-clutter a house, but this task can become a lot simpler with the help of this complete guide, “Your One Month Guide To Beating Clutter,” developed by the folks at Terrys Fabrics.
Evening Etiquette: A Gentlemans Guide
The definition of a Gentleman has evolved over the years and continues to evolve in faster in the digital age. Centuries ago it was used to refer to a man of good birth, yet it quickly changed to a description of any man who posses a certain level of refinement and intelligence. To help the modern man become the modern gentleman, the restaurant and live music venue Boisdale have created an iconographic on mens etiquette.
The Perfect Data Storm
More people are using visually heavy content online. This could result in network slow-downs and higher costs for subscribers. Check out the infographic below presented by Qualcomm Spark to learn about the data storm that is heading our way and what network providers can do to weather the storm.
The Great Gold Rout
What caused the sudden drop in gold price? After a decade of revival, the price fall in April was the biggest dip in market confidence for 30 years. Is this precious metal vulnerable to further decline or is it a temporary setback for the ‘safe-haven asset’? Take a look at the Great Gold Rout infographic from Saxo Capital Markets.
HTML5 Vs Native App Battle
HTML5 vs Native App battle has been going on from long now. While most mobile app developers with enough time and money resources still prefer to go with Native Apps, others are using HTML5 or Hybrid apps to reduce development time.This infographic lists important points through visually rich graphics.
The Growing Mobile (Digital) Publishing Landscape
This infographic from Readz provides an overview of some key numbers in the mobile (digital) publishing landscape. You will find stats on the growing ownership of devices, where reading scores appear in comparison to other favorite activities on devices, when people like to read and on which particular device as well as other such relevant information.
The Truth About the UK’s Legs
Daylong asked 2,000 people all about their legs and answers came in all shapes and sizes. They learned the who, what, where and why of tired, aching legs. They also learned what the UK thinks of compression hosiery. It’s all below in the following infographic simply entitled, “The Truth About the UK’s Legs.”
The War on Drug Communities
We have been fighting a War on Drugs since 1971, but what do we have to show for it? Millions of addicts, and to support them, there are millions of people who farm, produce, and distribute the drugs they use. We often don’t think of these poor families because they are not here in the United States – they are in other parts of the war.
Is Online Giving Right For Your Church?
By implementing online giving, churches can see an increase in offerings. Why is this? Because no one really carries around cash and checks anymore, so this gives people a quick and easy way to donate. It can also turn irregular givers into regular givers with options such as recurring payments. Check out the infographic below to learn more about the benefits of online giving for churches.
Have You Seen Your Online Reputation?
The digital revolution has made it increasingly difficult for a brand to maintain control of its online reputation. From talk on social media to articles on other websites and mentions via search engines, it seems like everyone has an opinion about brands and an abundance of online channels to share these views. While positive posts can have a great effect on brand image and sales, negative talk can cause serious harm that could damage a brand for the long-term.
Conquer Clutter in a Month
We all know how difficult it is to de-clutter a house, but this task can become a lot simpler with the help of this complete guide, “Your One Month Guide To Beating Clutter,” developed by the folks at Terrys Fabrics.
Evening Etiquette: A Gentlemans Guide
The definition of a Gentleman has evolved over the years and continues to evolve in faster in the digital age. Centuries ago it was used to refer to a man of good birth, yet it quickly changed to a description of any man who posses a certain level of refinement and intelligence. To help the modern man become the modern gentleman, the restaurant and live music venue Boisdale have created an iconographic on mens etiquette.
The Perfect Data Storm
More people are using visually heavy content online. This could result in network slow-downs and higher costs for subscribers. Check out the infographic below presented by Qualcomm Spark to learn about the data storm that is heading our way and what network providers can do to weather the storm.
Partners


Browse Archives By Category
Animated Infographics
Business Infographics
Career & Jobs Infographics
Education Infographics
Entertainment Industry Infographics
Environmental Infographics
Finance & Money Infographics
Food & Drink Infographics
Health Infographics
Historical Infographics
Home & Garden Infographics
Internet Infographics
Law and Legal Infographics
Lifestyle Infographics
Marketing Infographics
Offbeat Infographics
Parenting Infographics
Pets & Animals Infographics
Political Infographics
Shopping Infographics
Sports and Athletic Infographics
Technology Infographics
Transportation Infographics
Travel Infographics
Video Infographics