


Search 12,100+ Infographics!

How To Cope With Anxiety
Anxiety affects most people at one point or another. Learning to cope with anxiety is an important skill that everyone should have. Ways to cope with anxiety include putting your phone away, only reading credible news sources, getting enough sleep, limiting caffeine intake, practicing mindfulness, eating a healthy balanced diet, limiting alcohol consumption, exercising regularly, and even connecting with others.
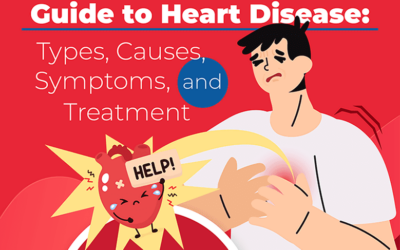
Guide to Heart Disease: Types, Causes, Symptoms, and Treatment
Failure to care for your heart runs the risk of developing heart disease or cardiovascular disease (CVD). Different types of heart diseases show varying symptoms and affect a specific part of the cardiovascular system. Check out the following infographic to determine the various types of heart disease alongside their causes, symptoms, and treatment options.

Home Security: What You Need To Do
Home security is a valuable investment today since 1 out of ever 40 houses in Australia are burgled in a year. It’s important to be familiar with the different types of home security systems first to determine what’s right for your home and your needs. The following infographic takes a look at home security and what you need to do to be safe.

Which World Cities Have the Highest Concentrations of Billionaires?
Where would you live if money was no object? In truth, one’s location has a significant influence on opportunities for wealth, investing, and connections, but success (or a fortunate birth) happens across the globe. This infographic shows where the worlds billionaires live.

The Business of Women’s Sports
The popularity of women’s sports continues to grow. In 2020, viewership in the National Women’s Soccer League grew nearly a whopping 300%. It’s about time for women to be compensated fairly and close the pay gap with their male counterparts. Check out the latest infographic from lines.com for more information on the subject.
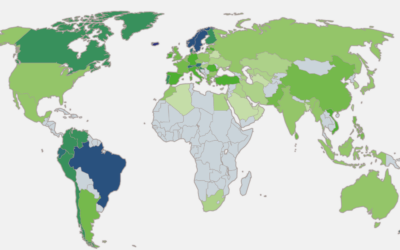
Countries With the Largest Shares of Renewable and Solar Energy
This visual graph from SolarPower.Guide shows places in the world with the highest shares of primary energy from renewable sources as of 2019. You can see the biggest leaders that have a share over 35% as of 2019 are Iceland, Norway, Brazil, Sweden, and New Zealand.
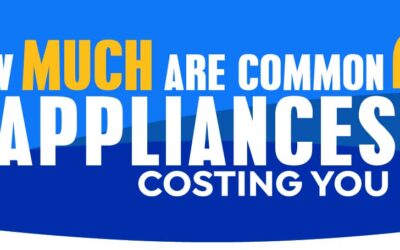
How Much Are Common Appliances Costing You?
How much are the appliances in your home actually costing you? It only takes a little bit of energy to save on energy costs. Even the small costs can add up in a very big way. This guide from Solar Power Guide shows both the estimated energy use and the estimated energy cost for common appliances and electronics around your home.
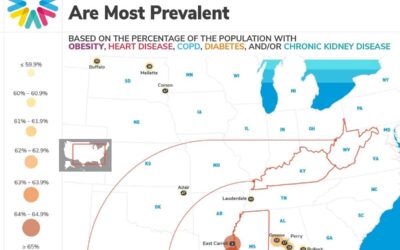
50 U.S. Counties Where Chronic Diseases Are Most Prevalent
According to the Centers for Disease Control and Prevention, 6 in 10 Americans have a chronic disease, and 4 in 10 Americans are living with at least two chronic conditions. The HealthChampion research team analyzed data on the prevalence of obesity, heart disease, chronic obstructive pulmonary disease (COPD), diabetes, and chronic kidney disease to see which U.S. counties have the highest overall prevalence of chronic conditions.

Is Your Bathroom Eco-Friendly? Tips for a Sustainable Bathroom
Home interior is usually the first place that springs to mind when thinking about little gestures one can do for the planet. In fact, there’s lots to do to make your space more environmentally friendly, even… your bathroom. The team at Bathing Solutions have done research to find out the best ways you can adapt your bathroom to make it more eco-friendly. This visual provides top tips for a more sustainable bathroom.

The Power Of Social Trust
An astonishing 33% of consumers say that they frequently ask their friends or family before buying new products and services. “Social trust” therefore is very important for a business to be successful online. Natalieminh Interactive has shared the following infographic with us which provides valuable insight into the power of social trust.
How To Cope With Anxiety
Anxiety affects most people at one point or another. Learning to cope with anxiety is an important skill that everyone should have. Ways to cope with anxiety include putting your phone away, only reading credible news sources, getting enough sleep, limiting caffeine intake, practicing mindfulness, eating a healthy balanced diet, limiting alcohol consumption, exercising regularly, and even connecting with others.
Guide to Heart Disease: Types, Causes, Symptoms, and Treatment
Failure to care for your heart runs the risk of developing heart disease or cardiovascular disease (CVD). Different types of heart diseases show varying symptoms and affect a specific part of the cardiovascular system. Check out the following infographic to determine the various types of heart disease alongside their causes, symptoms, and treatment options.
Home Security: What You Need To Do
Home security is a valuable investment today since 1 out of ever 40 houses in Australia are burgled in a year. It’s important to be familiar with the different types of home security systems first to determine what’s right for your home and your needs. The following infographic takes a look at home security and what you need to do to be safe.
Which World Cities Have the Highest Concentrations of Billionaires?
Where would you live if money was no object? In truth, one’s location has a significant influence on opportunities for wealth, investing, and connections, but success (or a fortunate birth) happens across the globe. This infographic shows where the worlds billionaires live.
The Business of Women’s Sports
The popularity of women’s sports continues to grow. In 2020, viewership in the National Women’s Soccer League grew nearly a whopping 300%. It’s about time for women to be compensated fairly and close the pay gap with their male counterparts. Check out the latest infographic from lines.com for more information on the subject.
Countries With the Largest Shares of Renewable and Solar Energy
This visual graph from SolarPower.Guide shows places in the world with the highest shares of primary energy from renewable sources as of 2019. You can see the biggest leaders that have a share over 35% as of 2019 are Iceland, Norway, Brazil, Sweden, and New Zealand.
How Much Are Common Appliances Costing You?
How much are the appliances in your home actually costing you? It only takes a little bit of energy to save on energy costs. Even the small costs can add up in a very big way. This guide from Solar Power Guide shows both the estimated energy use and the estimated energy cost for common appliances and electronics around your home.
50 U.S. Counties Where Chronic Diseases Are Most Prevalent
According to the Centers for Disease Control and Prevention, 6 in 10 Americans have a chronic disease, and 4 in 10 Americans are living with at least two chronic conditions. The HealthChampion research team analyzed data on the prevalence of obesity, heart disease, chronic obstructive pulmonary disease (COPD), diabetes, and chronic kidney disease to see which U.S. counties have the highest overall prevalence of chronic conditions.
Is Your Bathroom Eco-Friendly? Tips for a Sustainable Bathroom
Home interior is usually the first place that springs to mind when thinking about little gestures one can do for the planet. In fact, there’s lots to do to make your space more environmentally friendly, even… your bathroom. The team at Bathing Solutions have done research to find out the best ways you can adapt your bathroom to make it more eco-friendly. This visual provides top tips for a more sustainable bathroom.
The Power Of Social Trust
An astonishing 33% of consumers say that they frequently ask their friends or family before buying new products and services. “Social trust” therefore is very important for a business to be successful online. Natalieminh Interactive has shared the following infographic with us which provides valuable insight into the power of social trust.
Partners


Browse Archives By Category
Animated Infographics
Business Infographics
Career & Jobs Infographics
Education Infographics
Entertainment Industry Infographics
Environmental Infographics
Finance & Money Infographics
Food & Drink Infographics
Health Infographics
Historical Infographics
Home & Garden Infographics
Internet Infographics
Law and Legal Infographics
Lifestyle Infographics
Marketing Infographics
Offbeat Infographics
Parenting Infographics
Pets & Animals Infographics
Political Infographics
Shopping Infographics
Sports and Athletic Infographics
Technology Infographics
Transportation Infographics
Travel Infographics
Video Infographics