Search 12,000+ Infographics!
The History of Robert’s Rebellion
Game of Thrones can be confusing for people that are just beginning to get into it. That is why Connect Your Home set out to create this infographic to help get both new and seasoned fans, alike, up to speed with what’s going on in Westeros. This infographic will take you on a journey through Robert’s Rebellion.
Keeping Your Baby Safe
PishPoshBaby has created the following infographic about baby safety, at home and elsewhere. Anyone who has a baby can learn many useful things from this guide to important baby safety information.
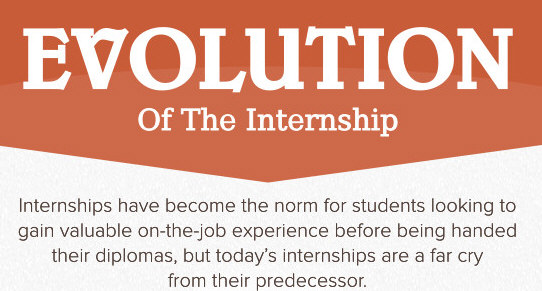
The Evolution of The Internship
Today’s students embark on internships during college to gain out-of-the-classroom experience prior to entering their industry. But did you know that the predecessor of today’s internship came to life in the 11th century? The interns of the past were apprentices seeking practical experience to grow their skill set in a trade, art, or calling.
Is Your McMansion Killing You?
Does having a bigger house really make life easier or better? Building and living costs are exponentially higher, children are spending 10 times as much time watching TV or playing video games as they do playing outside, and obesity rates have increased over 214 percent since 1950. It might be time to rethink the “McMansion.” To learn more about the costs and health risks associated with “McMansions,” check out this infographic presented by HomeInsurance.com.
Top 4 Digital Marketing Trends for 2013
The following infographic from Dot Com Infoway provides a comprehensive analysis of tools and technologies that will define the digital marketing landscape this year. It traces the impact of the digital revolution on consumer behavior and highlights key trends that marketers need to focus on in 2013.
Side Effects of Minera
Many women have chosen to use the Mirena Intrauterine Device (Minera IUD) because of its ease of use. Once your doctor places Minera, it can last for up to five years. It is also the only birth control approved to treat heavy period. However, people may not know about some of this popular device’s side effects when using. Learn more about the side effects of Minera in this infographic.
Engagement Ring Guide
Getting ready to pop the question to that special someone? Brilliance has got your back with this helpful infographic on how to find that engagement ring that complements her unique style. You can read up on important aspects of engagement ring buying via sections like budget factors, choice of metals, how to choose a diamond setting, choosing the diamond itself, diamond shapes, the surprise factor, making your purchase, and how to protect your purchase.
Executive Twits: Inside The Mind of a CE(psych)O
It takes a different sort of mind to run a major company successfully. Sometimes it’s genius that sets apart the business elite-but sometimes it just may be madness. www.psychdegrees.org takes a look at the studies and profiles that show what make these leaders tick-and why that ticking sound may just be a psychopathic time bomb.
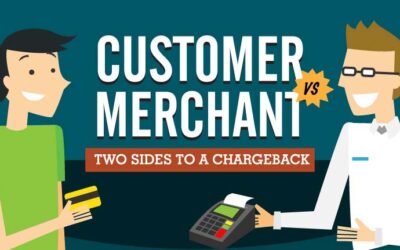
Merchant Vs. Customer: Two Sides to a Chargeback
As a small business owner, you’re already intimately familiar with the frustrations that the chargeback process entails. But have you ever stopped to look at chargebacks from the point of view of your customers? By gaining a fuller understanding of why and how chargebacks occur, you’ll be better able to prevent these potentially-costly situations in the future.
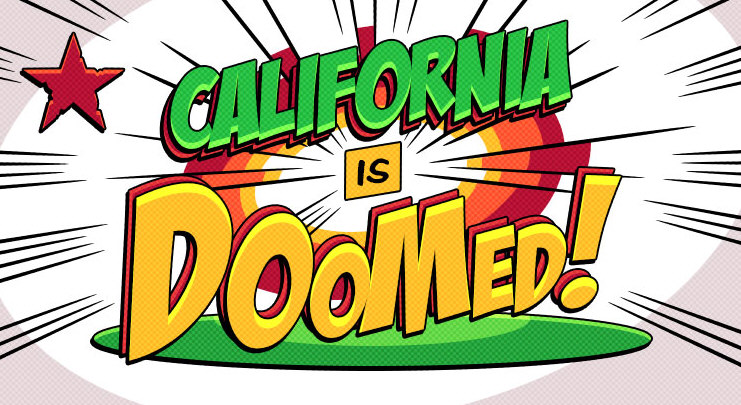
California is Doomed!
Problems run amok at all levels in the government – local, state, and federal. Years of outrageous healthcare benefits, pensions and salaries have made municipalities so broke that they cannot afford to pay for police, firefighters or even garbage collectors. It’s been voted the worst state to do business by CEOs for 7 years now. It is evident, California is doomed.
Partners
Browse Archives By Category
Animated Infographics
Business Infographics
Career & Jobs Infographics
Education Infographics
Entertainment Industry Infographics
Environmental Infographics
Finance & Money Infographics
Food & Drink Infographics
Health Infographics
Historical Infographics
Home & Garden Infographics
Internet Infographics
Law and Legal Infographics
Lifestyle Infographics
Marketing Infographics
Offbeat Infographics
Parenting Infographics
Pets & Animals Infographics
Political Infographics
Shopping Infographics
Sports and Athletic Infographics
Technology Infographics
Transportation Infographics
Travel Infographics
Video Infographics


