

Search 12,000+ Infographics!
Orlando by Numbers
If you’re fascinated by Orlando’s attractions and want to know the number of bricks in Legoland Florida or the size of all the lagoons at Typhoon Lagoon, take a look at this infographic from Attraction Tickets Direct.
Classroom Technology: Turning Our Kids Into Nerds
Technology in the classroom is inevitable, but how do both teachers and parents feel about it? Check out this infographic to learn about tech and education.
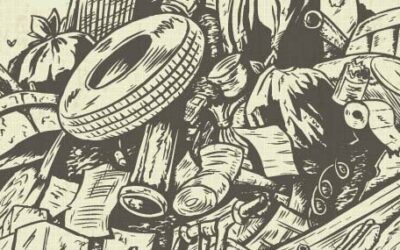
10 Reasons Why You’ll Be Buried Alive
Producing more trash than any other country in the world, America throws away more than 500 billion pounds of trash per year, with each person throwing a stunning 4.4 pounds of trash away per day. Did you know that 1 plastic bottle takes 700 years to begin composting?
Why Buying Local is Worth Every Cent
Supporting your local, independent business owners, makers, and artists can make a huge impact on your community’s economy. Buying local cuts down on transport, shipping, and packaging, creating a greener purchasing experience. Also, while big box retail generates a net annual deficit of $468 per 1,000 sq. ft., buying from local specialty retail produces a net annual RETURN of $326 per 1,000 sq. ft. This is because supporting local businesses keeps money in the community’s economy, rather than immediately sending the money to corporate headquarters off-site.
Artificial Intelligence: Working Hard, So We Can Hardly Work
There are currently 1.1 million working robots in the world. We use Artificial Intelligence every day, from car production to Siri, AI is everywhere. Check out the infographic below presented by ClickSoftware to learn more about how we use AI.

Earth Day
It’s that time of year again — time to give our dear home, Mother Earth, some love. It’s sad that many people only recognize our world and the state it is in once a year. Want to know more about the place we call home? Check out this infographic from eReplacementParts.com for facts, history and scary statistics.
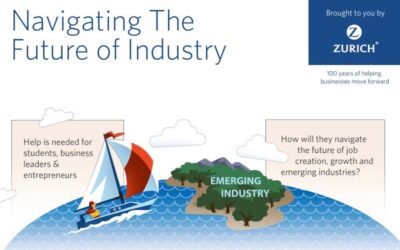
Navigating the Future of Industry
Preparing for the future of industry can be daunting. This infographic presented by Zurich takes a look at how students, business leaders and entrepreneurs can navigate the future of industry.

YouTube Sensations – Where Are They Now?
In celebration of Psy taking the crown for producing the first video to hit and surpass one billion views on YouTube, here is an infographic with a compilation of the greatest YouTube video sensations and viral videos and where they are now.
Formal Degree vs. Self Taught
Formal degree or self taught – which is better? A carefully designed course, filled with modules covering the industry’s most commonly requested skills; or hard work and self application, learning techniques as and when required?

What Is Your Greatest Footprint? (Carbon vs Water)
The average Irish citizen creates 4,855 cubic metres of CO2E per year. They also use 1,301 cubic metres of water per year, making their carbon footprint 3.75 times as big as their water footprint. This infographic from Calor Gas looks at ways to try and reduce these.
Orlando by Numbers
If you’re fascinated by Orlando’s attractions and want to know the number of bricks in Legoland Florida or the size of all the lagoons at Typhoon Lagoon, take a look at this infographic from Attraction Tickets Direct.
Classroom Technology: Turning Our Kids Into Nerds
Technology in the classroom is inevitable, but how do both teachers and parents feel about it? Check out this infographic to learn about tech and education.
10 Reasons Why You’ll Be Buried Alive
Producing more trash than any other country in the world, America throws away more than 500 billion pounds of trash per year, with each person throwing a stunning 4.4 pounds of trash away per day. Did you know that 1 plastic bottle takes 700 years to begin composting?
Why Buying Local is Worth Every Cent
Supporting your local, independent business owners, makers, and artists can make a huge impact on your community’s economy. Buying local cuts down on transport, shipping, and packaging, creating a greener purchasing experience. Also, while big box retail generates a net annual deficit of $468 per 1,000 sq. ft., buying from local specialty retail produces a net annual RETURN of $326 per 1,000 sq. ft. This is because supporting local businesses keeps money in the community’s economy, rather than immediately sending the money to corporate headquarters off-site.
Artificial Intelligence: Working Hard, So We Can Hardly Work
There are currently 1.1 million working robots in the world. We use Artificial Intelligence every day, from car production to Siri, AI is everywhere. Check out the infographic below presented by ClickSoftware to learn more about how we use AI.
Earth Day
It’s that time of year again — time to give our dear home, Mother Earth, some love. It’s sad that many people only recognize our world and the state it is in once a year. Want to know more about the place we call home? Check out this infographic from eReplacementParts.com for facts, history and scary statistics.
Navigating the Future of Industry
Preparing for the future of industry can be daunting. This infographic presented by Zurich takes a look at how students, business leaders and entrepreneurs can navigate the future of industry.
YouTube Sensations – Where Are They Now?
In celebration of Psy taking the crown for producing the first video to hit and surpass one billion views on YouTube, here is an infographic with a compilation of the greatest YouTube video sensations and viral videos and where they are now.
Formal Degree vs. Self Taught
Formal degree or self taught – which is better? A carefully designed course, filled with modules covering the industry’s most commonly requested skills; or hard work and self application, learning techniques as and when required?
What Is Your Greatest Footprint? (Carbon vs Water)
The average Irish citizen creates 4,855 cubic metres of CO2E per year. They also use 1,301 cubic metres of water per year, making their carbon footprint 3.75 times as big as their water footprint. This infographic from Calor Gas looks at ways to try and reduce these.
Partners


Browse Archives By Category
Animated Infographics
Business Infographics
Career & Jobs Infographics
Education Infographics
Entertainment Industry Infographics
Environmental Infographics
Finance & Money Infographics
Food & Drink Infographics
Health Infographics
Historical Infographics
Home & Garden Infographics
Internet Infographics
Law and Legal Infographics
Lifestyle Infographics
Marketing Infographics
Offbeat Infographics
Parenting Infographics
Pets & Animals Infographics
Political Infographics
Shopping Infographics
Sports and Athletic Infographics
Technology Infographics
Transportation Infographics
Travel Infographics
Video Infographics