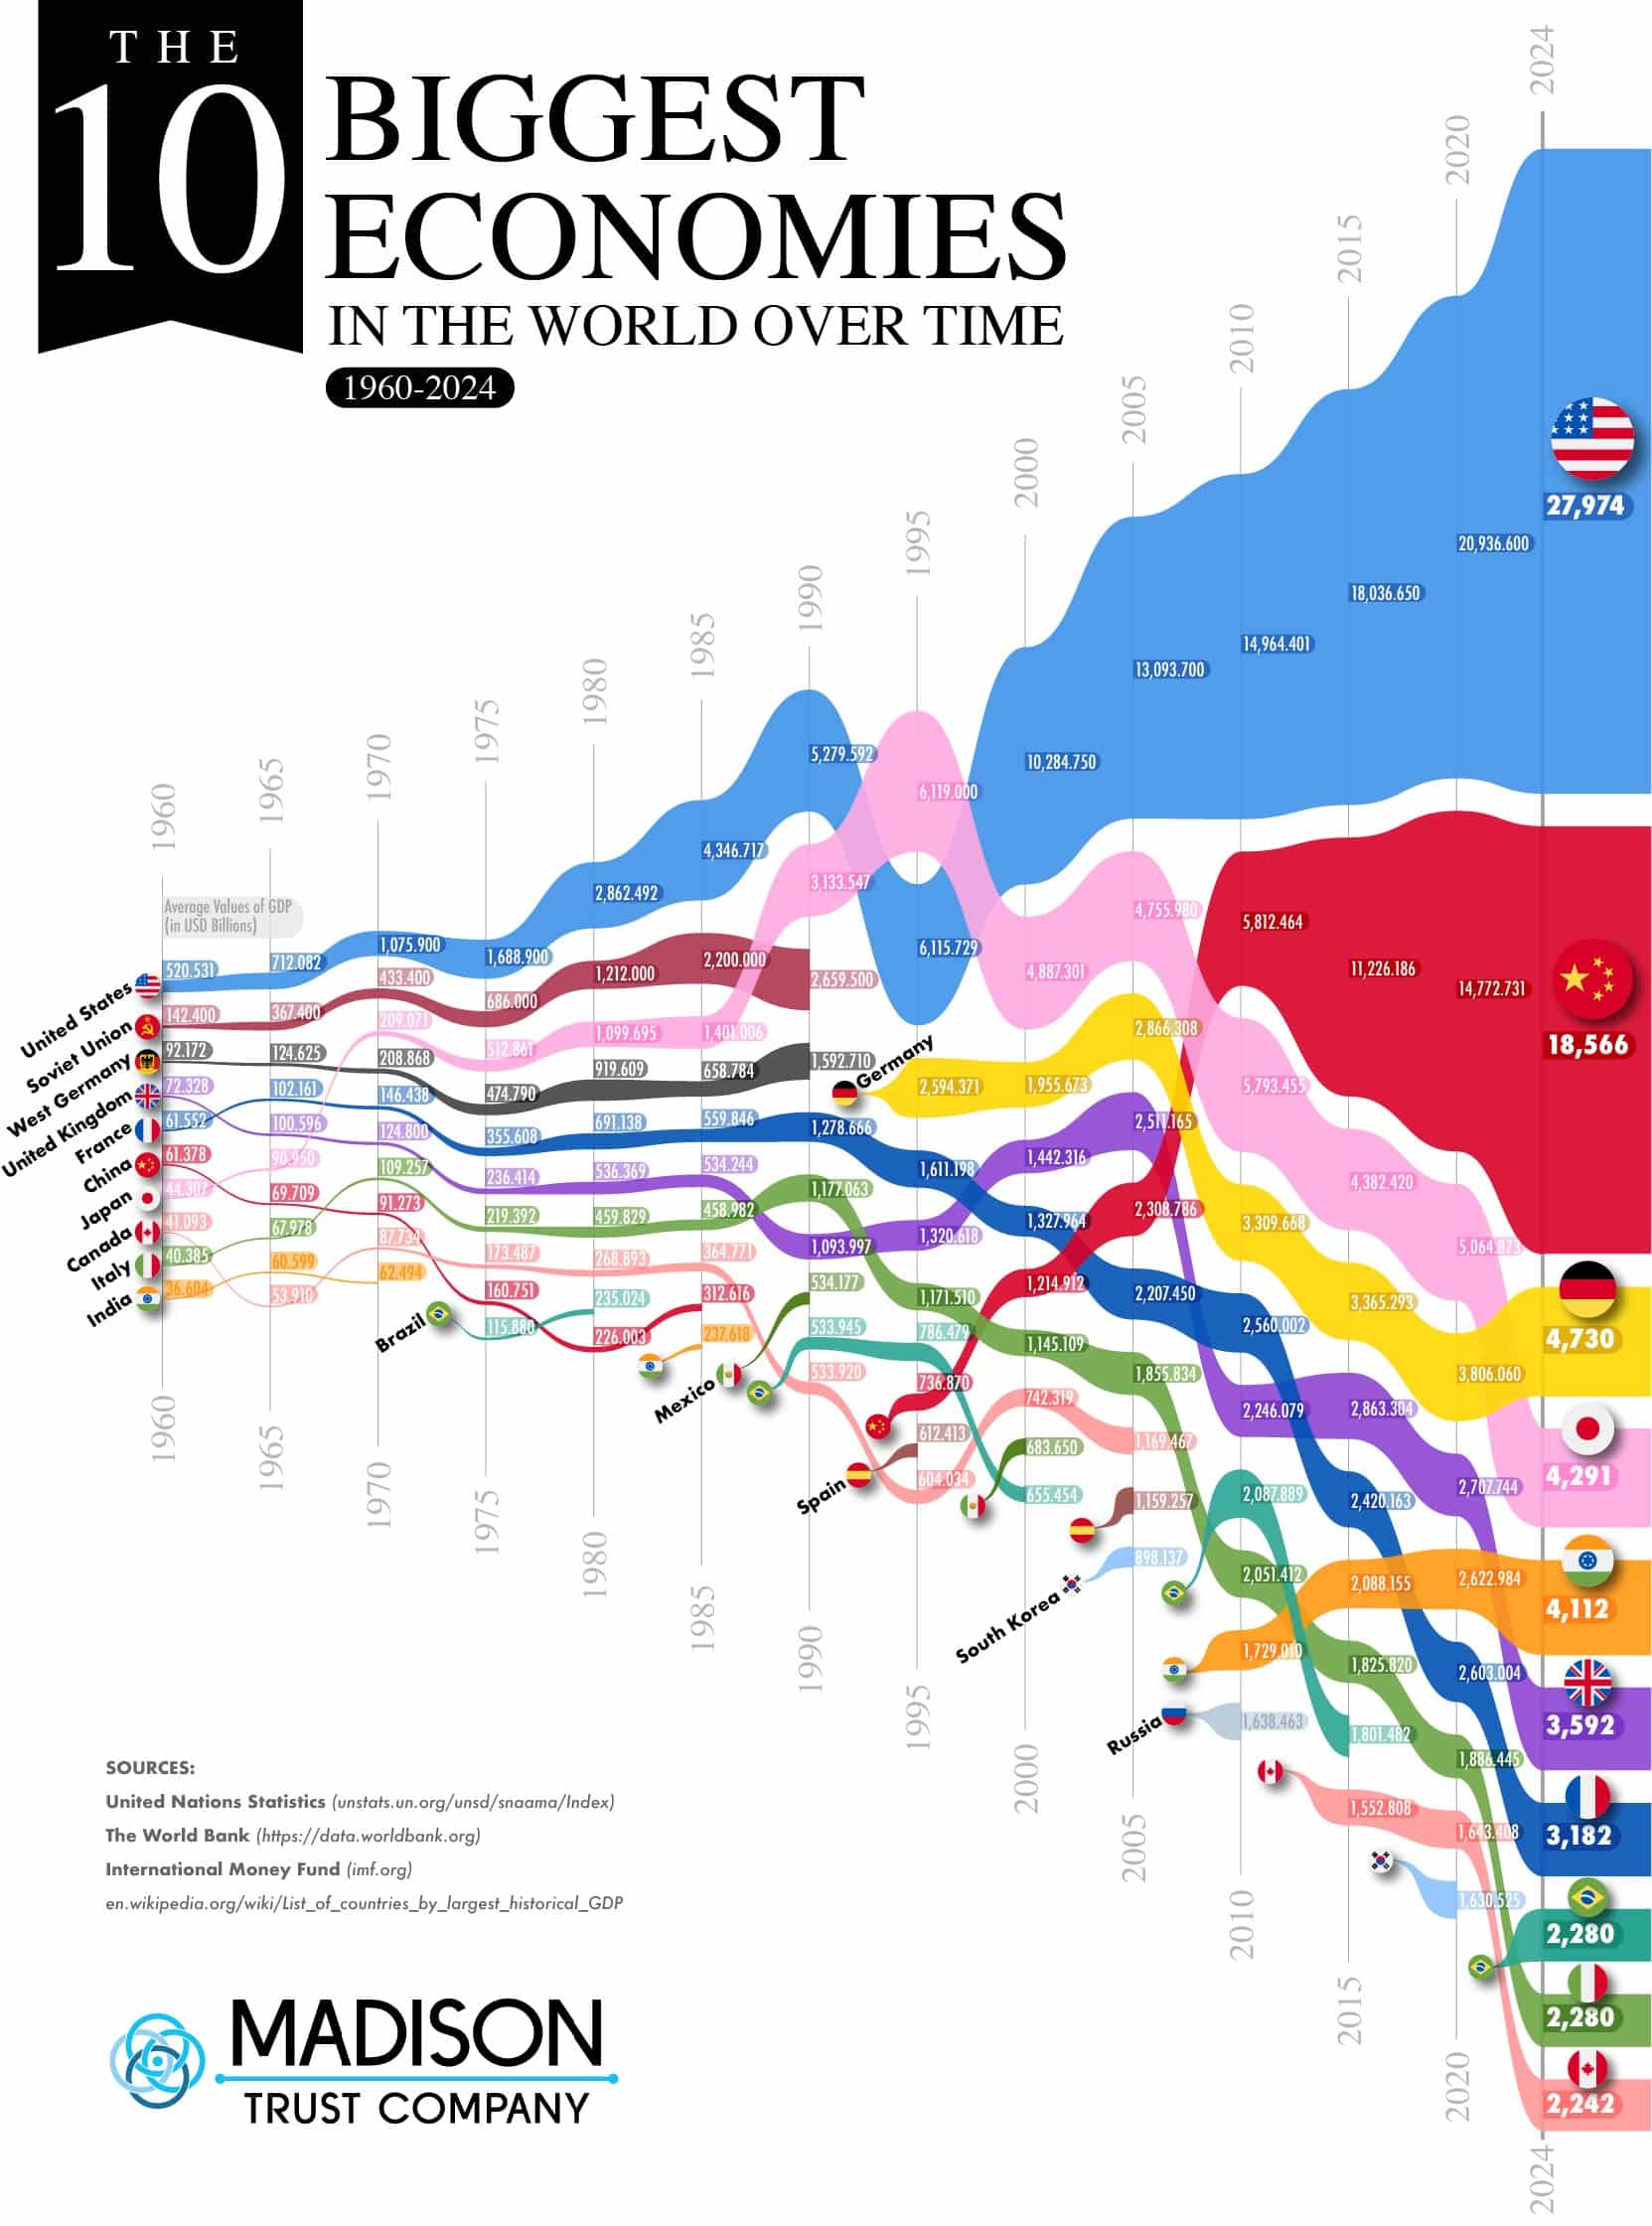
Studying economies over time can tell us a lot about different decades and what commerce countries relied on to rise and fall with the changes.
The team at Madison Trust Company have put together this illuminating graphic that shows the top 10 GDPs from 1960 to 2024. The graphic shows us that the United States leads world economies today, and they have for many decades.
The only significant change of fate for the US was a dip in the 90s in which Japan surpassed the U.S. This huge economic boom in Japan was driven by their production of electronics and cars. They had a boom of industrial growth after the Korean War and an expanding, motivated workforce.
As we can see on the graphic, this bubble burst after the 90s as a growing population stagnated. China became a powerful economic force in the mid-2000s surging to close the gap between their nation and the United States.


